Holoview Path really slow when color by column attribute

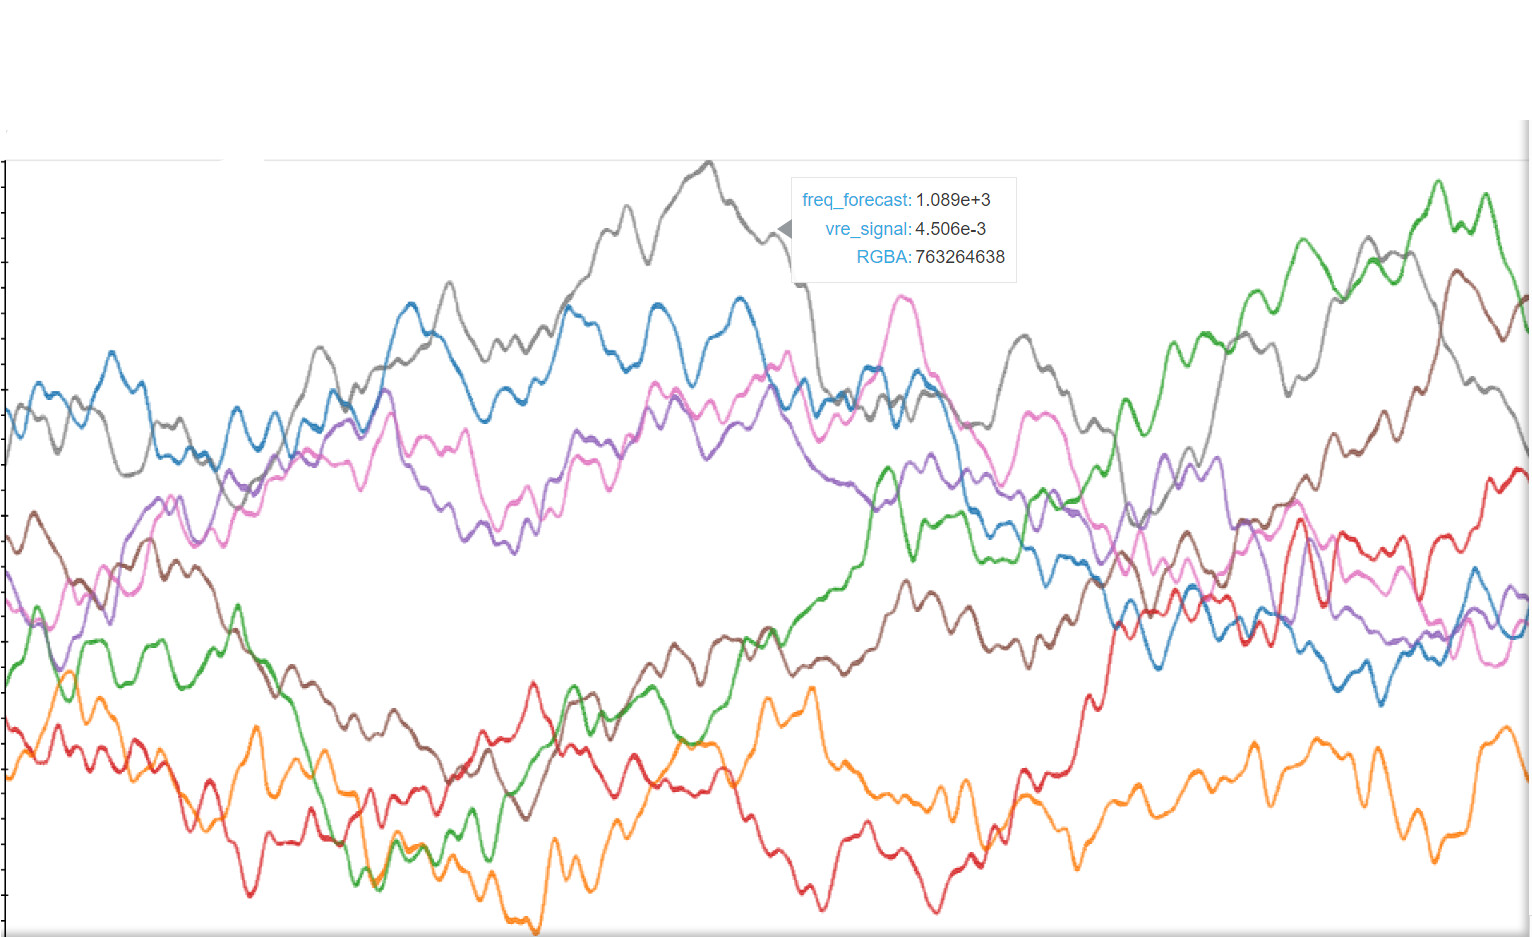
I want to plot multiple items with a unique ID, and each ID should be assigned a random color in order to be able to distinguish the IDs in the plot. Ideally there would be a legend to show what ID is what color.

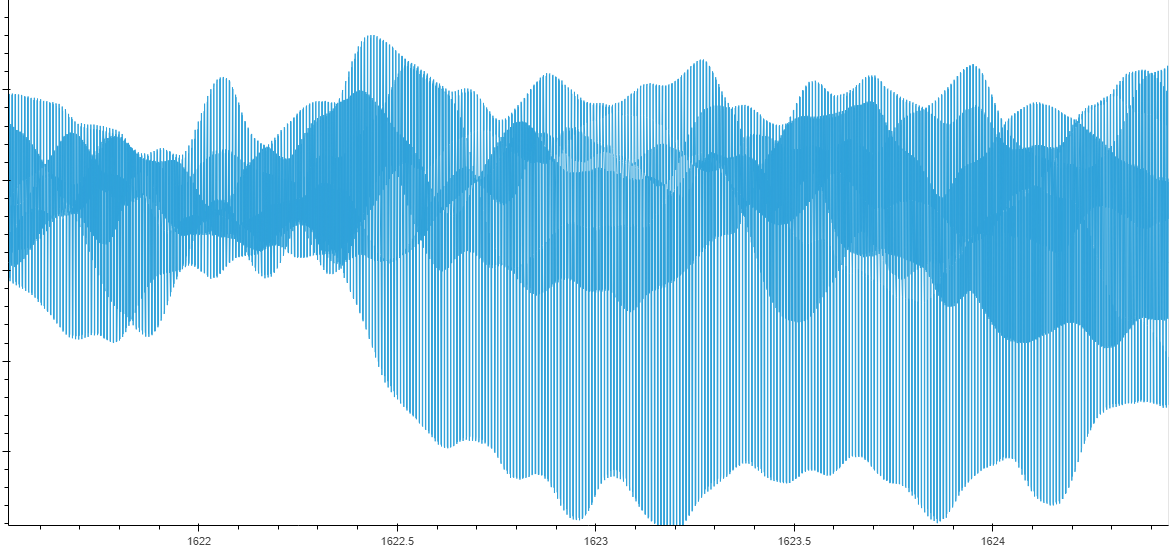
It is big data but when I do the plotting without assigning a color, it is super fast. As soon as I add “color=‘ID’” to the code it slows down 100x. Is there a better way to do this?

plot_column = pn.Column()

# Iterate through unique values of 'measurand' and create a separate plot for each
for measurand_value, group_df in selected_columns.groupby('measurand'):
    group_df = group_df.sort_values(by='frequency', ascending=True)  # Sort by 'frequency' in ascending order
    dataset = hv.Dataset(group_df, kdims=['frequency', 'signal'], vdims=['ID'])
    path_plot = hv.Path(dataset, label=f"'measurand': {measurand_value}").opts(
        width=1280, height=600, **color='ID'**
    )
    plot_column.append(path_plot)

Hi! Maybe this can help?
https://holoviews.org/user_guide/Large_Data.html#multidimensional-plots

Also, have you heard of hvplot? https://hvplot.holoviz.org/getting_started/hvplot.html

It makes it easy to overlay by separate group; something like:
df.hvplot(x, y, by="ID", datashade=True)

1 Like

thanks for this. it’s really fast. The only problem is that there is no legend, even when I set legend=True.
When I hover over the lines it does not show the corresponding ‘ID’ but the RGBA color information of the screen at that position. I tried ‘groupby’ instead of ‘by’ but that did not work either.

ropts = dict(tools=["hover"], height=200, width=400, ylim=y_range, legend_position='left')

plot = subset_df.hvplot('frequency', 'signal', by='ID', title=measurand_value, legend=True, datashade=True, shared_axes=False).opts(**ropts)