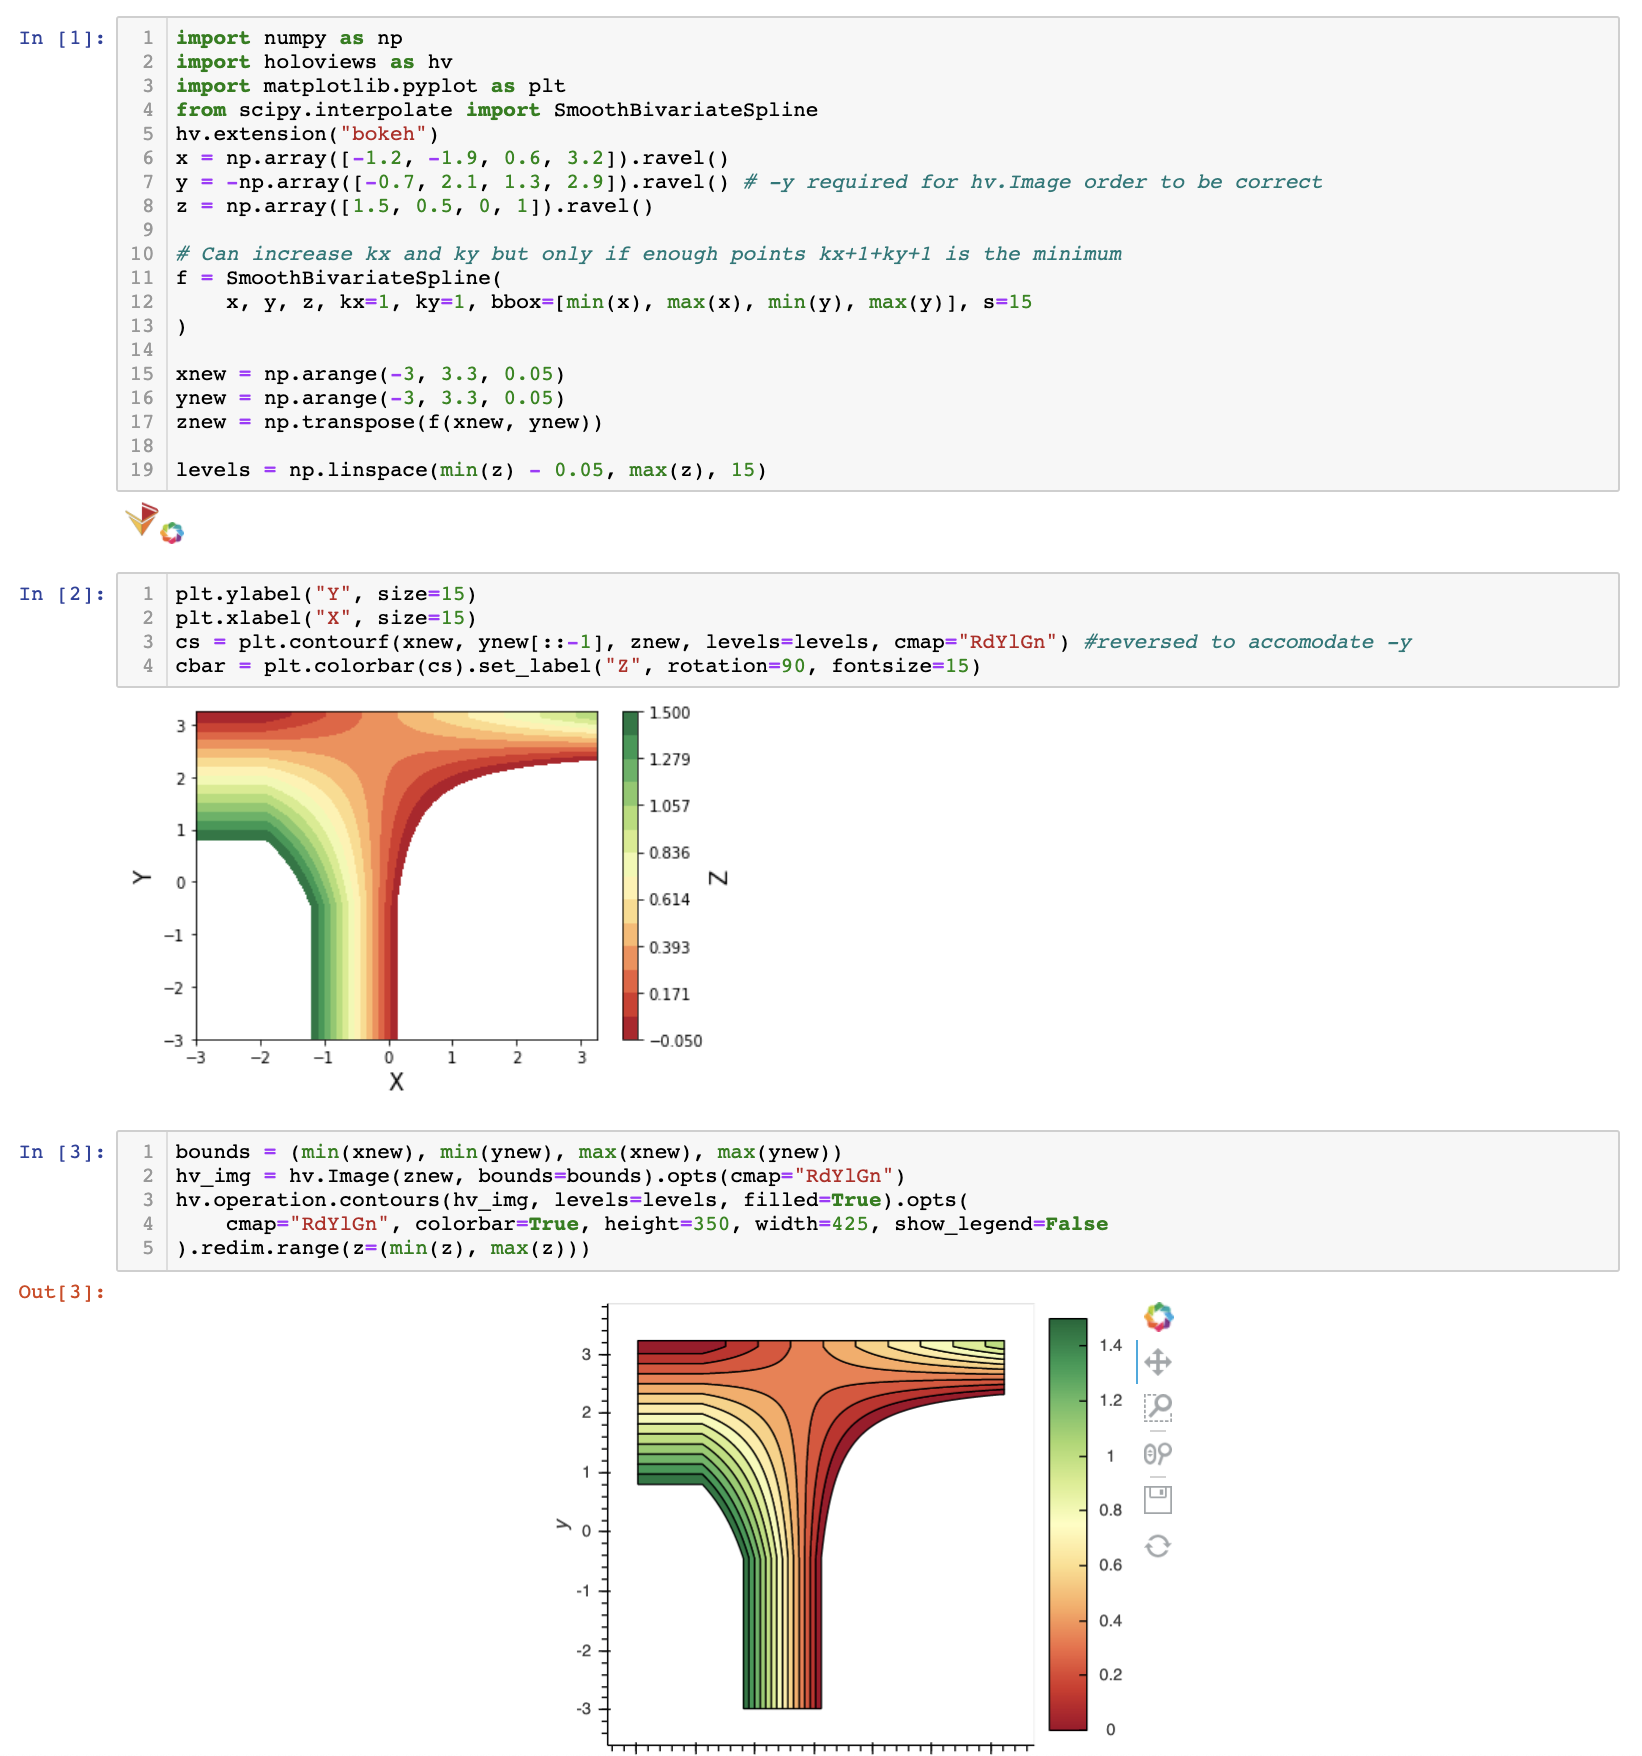
The linked Jupyter notebook and attached image shows that in order to get the consistency between holoviews Contour and Matplotlib contourf I had to reverse the sign of y (a reflection in the y-axis) for Holoviews.
Is this a bug, nuisance of hv.Image or some aspect of my code I have not fully understood? Any insights would be most welcome.
I do not use contourf of matplotlib usually, but in plt.imshow it happens the yaxis is reversed. The 0 value is conterintuitive and it is positioned in the top. It takes a time to get used to that.