Holoviews Ellipse and ESRI Map

I was trying to draw a circle (Ellipse) on top of an ESRI map to highlight antenna area coverage and ran into an issue where the radius of the circle does not cover the expected distance between points on the map.

To highlight my problem I have created the following example using this [Haversine Example](sklearn.metrics.pairwise.haversine_distances — scikit-learn 1.4.0 documentation as inputs.

import datashader as ds
import holoviews as hv
from holoviews.operation.datashader import datashade
from holoviews import opts
hv.extension("bokeh")

esri = (hv.element.tiles.EsriImagery().opts(width=600, height=550, backend="bokeh"))

from sklearn.metrics.pairwise import haversine_distances
from math import radians
bsas = [-34.83333, -58.5166646]
paris = [49.0083899664, 2.53844117956]
bsas_in_radians = [radians(_) for _ in bsas]
paris_in_radians = [radians(_) for _ in paris]
result = haversine_distances([bsas_in_radians, paris_in_radians])
print(result * 6371000/1000)  # multiply by Earth radius to get kilometers

#array([[    0.        , 11099.54035582],
#       [11099.54035582,     0.        ]])

x1, y1 = ds.utils.lnglat_to_meters(bsas[1], bsas[0])
ellipse = hv.Ellipse(x1, y1, 2 * result[0][1] * 6371000)
path = hv.Path([ellipse])
path.opts(color="yellow", line_width=4, alpha=0.5)
esri * path

image

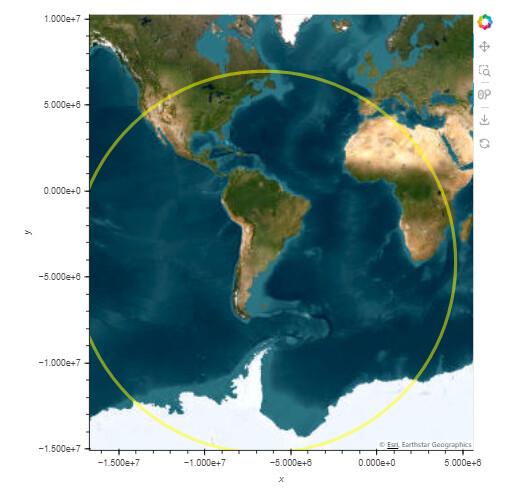
From the resulting image it is clear to see that the cirlce does not even reach France let alone Paris. The esri map is correct, the datashader lat/long conversion is correct i.e. centre of circle is in Buenos Aires and I didn’t think a simple example like this needed to worry about projections or crs (geoviews). So what am I missing?

I don’t think Ellipse is the route you should take since I think it works with screen coordinates(?)

To get accurate results, I believe you need to create a circle Polygon and project that.

Thanks for the response.

Your link pointed me down the right path. Here is how I solved it, first off the Beunos Aires - Paris example caused some weird rendering issues around the equator so changed these to Washington DC - New York. Then used Geodesic from cartopy.geodesic before converting back to meters using datashader.

from sklearn.metrics.pairwise import haversine_distances
from math import radians
wash = [38.897957, -77.036560]
newyork = [40.748817,  -73.985428]
wash_in_radians = [radians(_) for _ in wash]
newyork_in_radians = [radians(_) for _ in newyork]
result = haversine_distances([wash_in_radians, newyork_in_radians])
result * 6371000/1000  # multiply by Earth radius to get kilometers
from cartopy.geodesic import Geodesic  # from geographiclib
circles = Geodesic().circle(wash[1], wash[0], result[0][1] * 6371000, n_samples=100)
df = pd.DataFrame(circles, columns=['longitude','latitude'])
df['x'], df['y'] = ds.utils.lnglat_to_meters(df.longitude, df.latitude)

path = hv.Path(df[['x', 'y']])
path.opts(color="orange", line_width=4, alpha=0.4)
esri * path

Here is an image with the circle drawn from both starting points

image.

Zooming into the start points I can that the circle is not perfect but its close enough and this is perfect for my needs. .

Increasing n_samples should make the circle more “perfect” if I understand correctly.