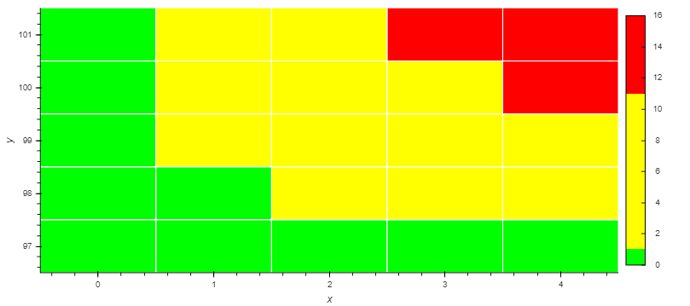
So I recently discovered an odd behavior using the color ranges based solution proposed on stackoverflow. Now I try to align the colormaps of multiple heatmap plots, which should be possible by supplying the same color intervals. Therefore, the maximum value of the color intervals does not necessarely match the maximum value in the heatmap, which sometimes leads to an odd behavior where a half open interval suddenly becomes a closed interval.
Below, you find the example given in the stackoverflow post where I adjust the “max_value” in order to get different interval bounds.
My goal is to have a color mapping where [0, 1) = green, [1, max_count / 2) = yellow, [max_count / 2, max_count) = red and max_count = violet.
However, with the first interval I get [0,1] (inclusive), where ‘1’ is part of the green color, whenever max_value reaches a specific threshold (in this example 23). Is this expected and if so, is there a way around that?
data = pd.DataFrame([(i, 97+j, i*j) for i in range(5) for j in range(5)], columns=[‘x’, ‘y’, ‘val’])
max_count = 23
# [0, 1, 11, 22, 23, 24]
# max_count = data.val.max()
# [0, 1, 8, 15, 16, 17]
red = ‘#FF0000’
yellow = ‘#FFFF00’
green = ‘#00FF00’
blue_violet = ‘#8A2BE2’
levels = [0, 1, int(max_count / 2), max_count - 1, max_count, max_count + 1]
colors = [green, yellow, red, blue_violet, blue_violet]
hv.HeatMap(data2).opts(width=900, height=400, cmap=colors, color_levels=levels, line_width=1).opts(colorbar=True)
