Hi all,
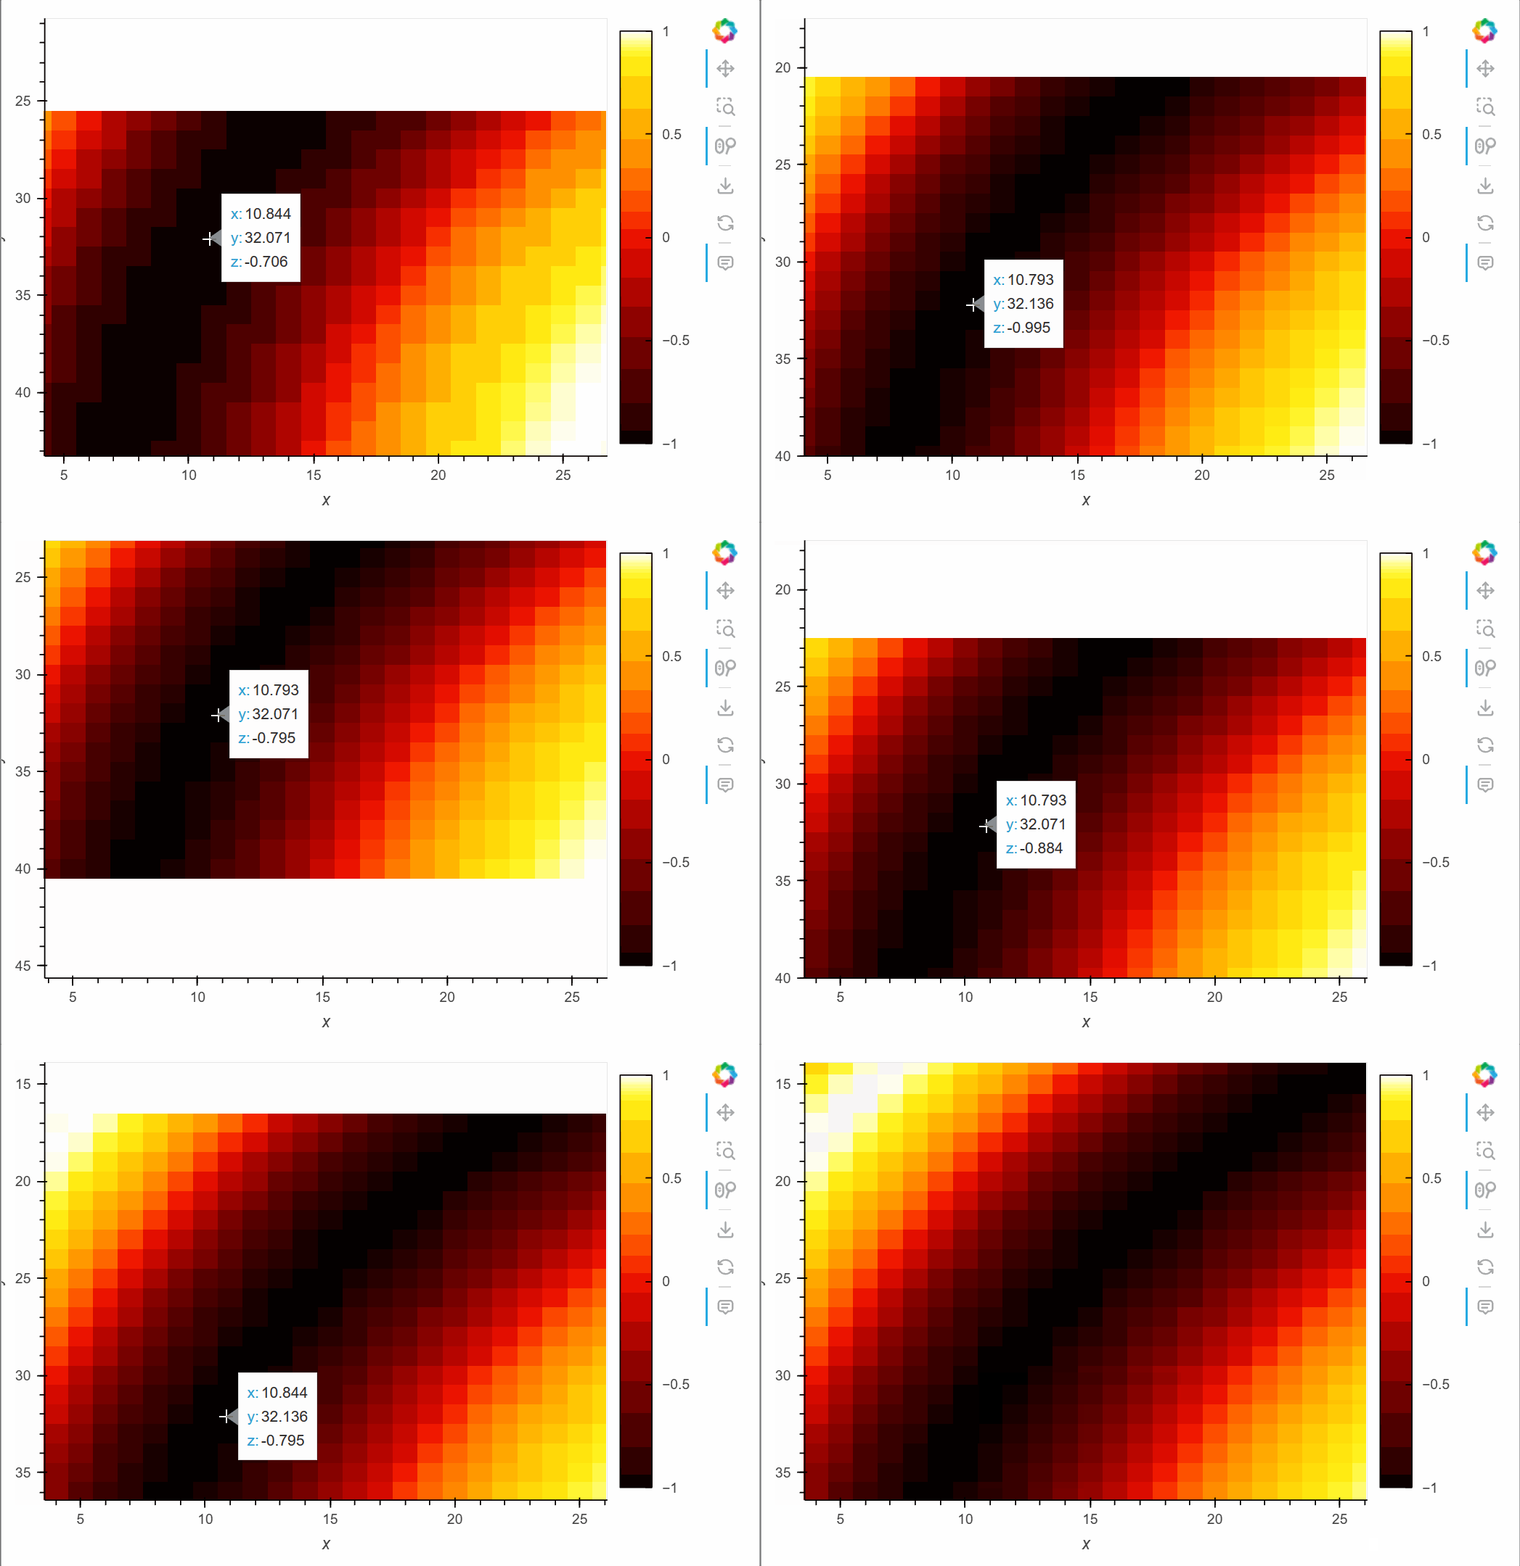
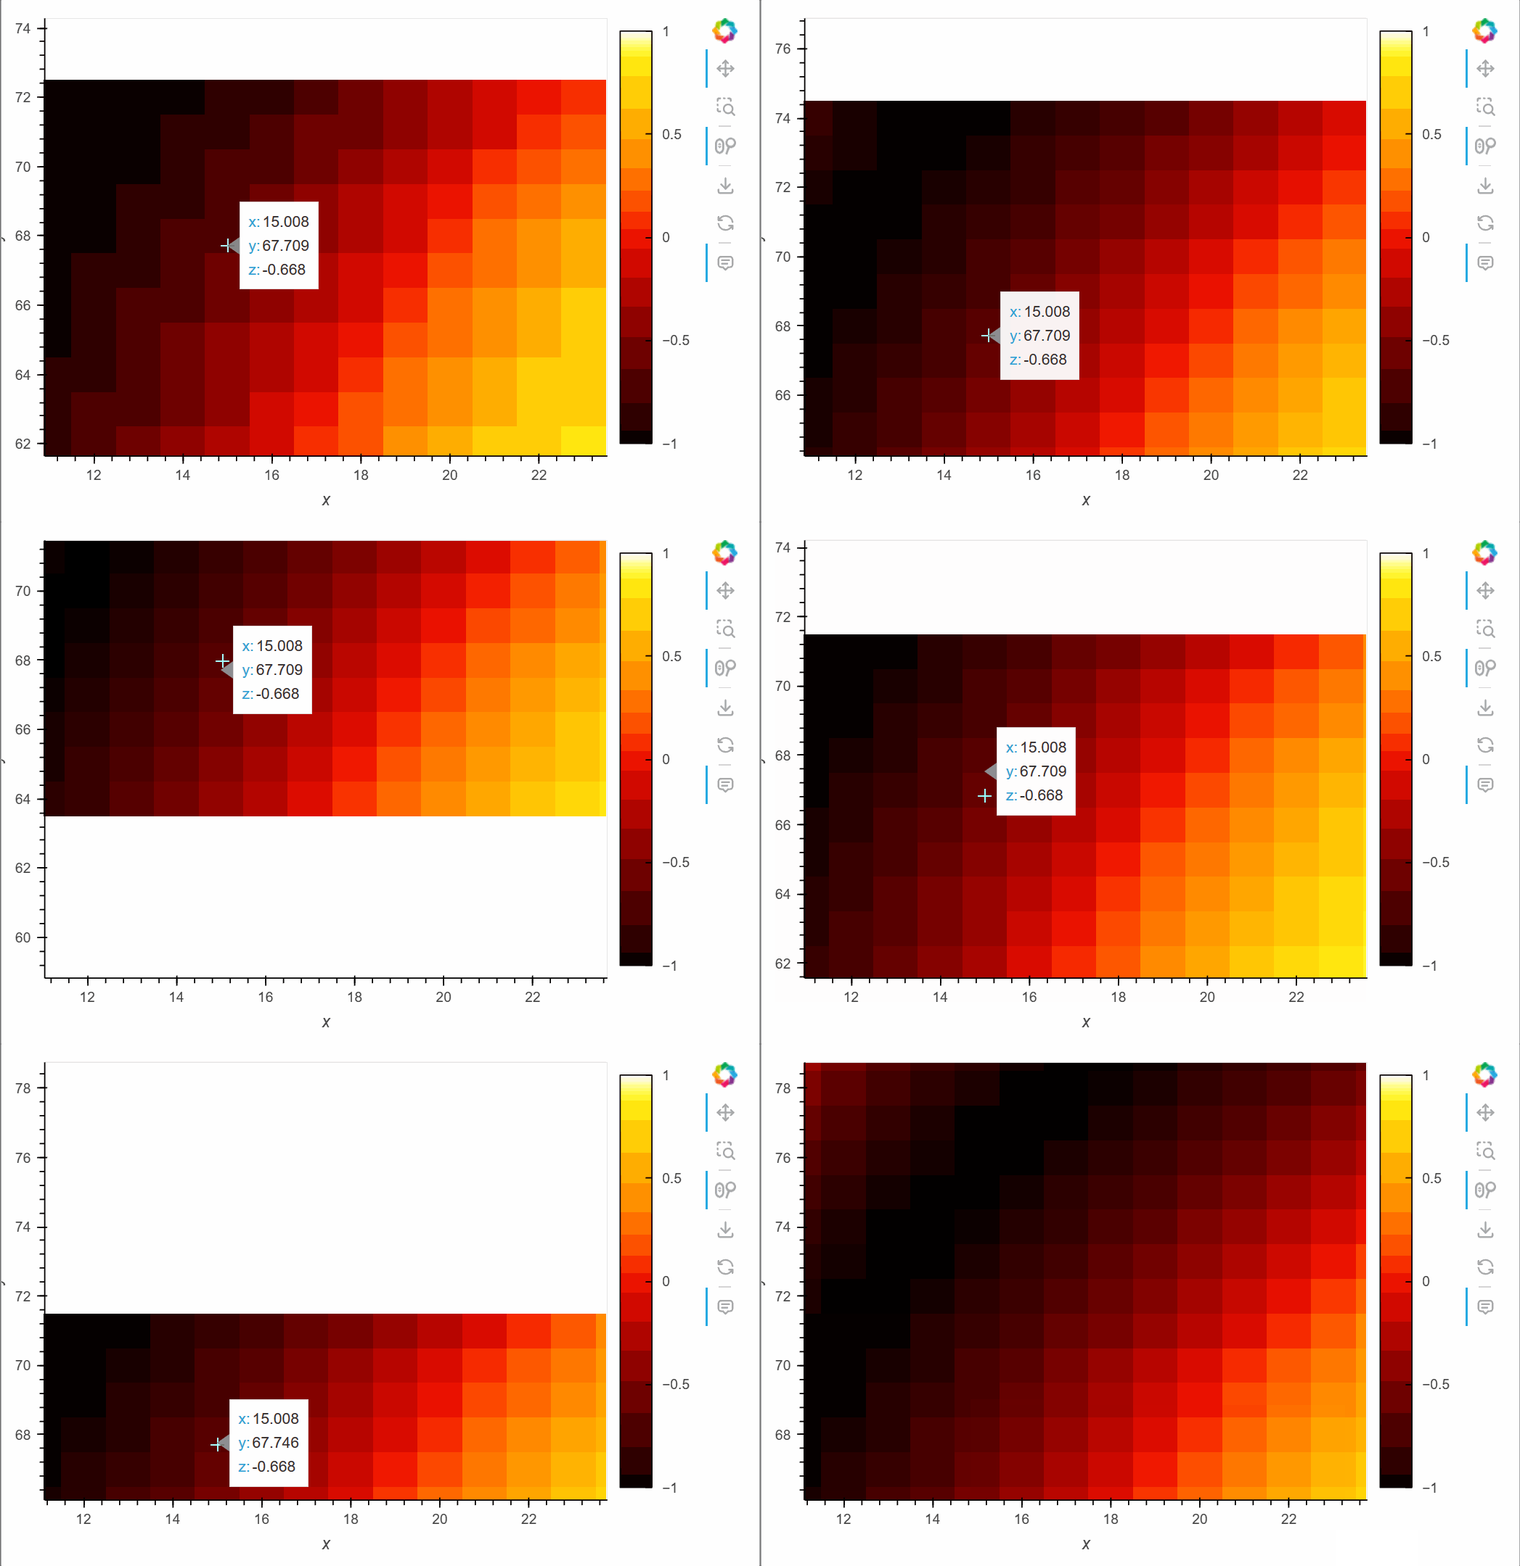
I am writing a dynamic map to automatically change the resolution to be plot. But I find when I set invert_yaxis=True, data value displayed on the hover is wrong. Here is the example:
import math
import numpy as np
import holoviews as hv
from holoviews import streams
from functools import partial

class Coord(object):
    def __init__(self,x0,dx,nx,y0,dy,ny):
        self.x0 = x0
        self.dx = dx
        self.nx = nx
        self.xm = x0+(nx-1)*dx
        self.y0 = y0
        self.dy = dy
        self.ny = ny
        self.ym = y0+(ny-1)*dy
        self.maxlevel = math.floor(math.log2(min(nx,ny)))

    def max_gix(self,level):
        return math.ceil(self.nx/(2**level))-1, math.ceil(self.ny/(2**level))-1

    def hv_bbox2gix_bbox(self,coord_bbox,level):
        x0, y0, xm, ym = coord_bbox
        xi0 = math.floor((x0-self.x0)/self.dx/2**level+0.5)
        yi0 = math.floor((y0-self.x0)/self.dx/2**level+0.5)
        xim = math.ceil((xm-self.x0)/self.dx/2**level-0.5)
        yim = math.ceil((ym-self.x0)/self.dx/2**level-0.5)

        xi_max, yi_max = self.max_gix(level)
        return sorted((0,xi0,xi_max))[1], sorted((0,yi0,yi_max))[1], sorted((0,xim,xi_max))[1], sorted((0,yim,yi_max))[1]

    def gix_bbox2hv_bbox(self,gix_bbox, level):
        xi_max, yi_max = self.max_gix(level)
        xi0, yi0, xim, yim = gix_bbox
        xi0, yi0, xim, yim = sorted((0,xi0,xi_max))[1], sorted((0,yi0,yi_max))[1], sorted((0,xim,xi_max))[1], sorted((0,yim,yi_max))[1]
        return (xi0-0.5)*2**level*self.dx+self.x0, (yi0-0.5)*2**level*self.dy+self.y0, (xim+0.5)*2**level*self.dx+self.x0, (yim+0.5)*2**level*self.dy+self.y0

def hv_image(x_range,y_range,width,height,scale,data,coord):
    if x_range is None:
        x0 = coord.x0; xm = coord.xm
    else:
        x0, xm = x_range
    if y_range is None:
        y0 = coord.y0; ym = coord.ym
    else:
        y0, ym = y_range
    if height is None: height = hv.plotting.bokeh.ElementPlot.height
    if width is None: width = hv.plotting.bokeh.ElementPlot.width

    x_res = (xm-x0)/width; y_res = (ym-y0)/height
    level = math.floor(math.log2(min(x_res,y_res)))
    level = sorted((0, level, coord.maxlevel))[1]
    xi0, yi0, xim, yim = coord.hv_bbox2gix_bbox((x0,y0,xm,ym),level)
    coord_bbox = coord.gix_bbox2hv_bbox((xi0, yi0, xim, yim),level)
    data_ = data[::2**level,::2**level][yi0:yim+1,xi0:xim+1]
    return hv.Image(data_[::-1,:],bounds=coord_bbox)

def ras_plot(data:np.array,
             bounds:tuple=None, # bounding box (x0, y0, x_max, y_max)
            ):
    ny, nx = data.shape

    if bounds is None:
        x0 = 0; dx = 1; y0 = 0; dy = 1
    else:
        x0, y0, xm, ym = bounds
        dx = (xm-x0)/(nx-1); dy = (ym-y0)/(ny-1)
    coord = Coord(x0,dx,nx,y0,dy,ny)

    rangexy = streams.RangeXY()
    plotsize = streams.PlotSize()
    images = hv.DynamicMap(partial(hv_image,data=data,coord=coord),streams=[rangexy,plotsize])
    return images
hv.extension('bokeh')

Y, X = (np.mgrid[0:100, 0:100]-50.)/20.

img = ras_plot(np.sin(X**2+Y**2))
img = img.redim(z=hv.Dimension('z',label='z',range=(-1,1)))

img.opts(hv.opts.Image(cmap='fire',width=600, height=400, colorbar=True,
                       tools=['hover',],
                       # invert_yaxis=True,
                       ))
With invert_yaxis=True:

With invert_yaxis=False:

Both of them generate the correct plot but the z value displayed on hover changes when I use the Pan tool for invert_yaxis=True.