I’ve got 2 datasets sharing the sames coordinates. I’m able to plot both images and the corresponding flattened scatter :
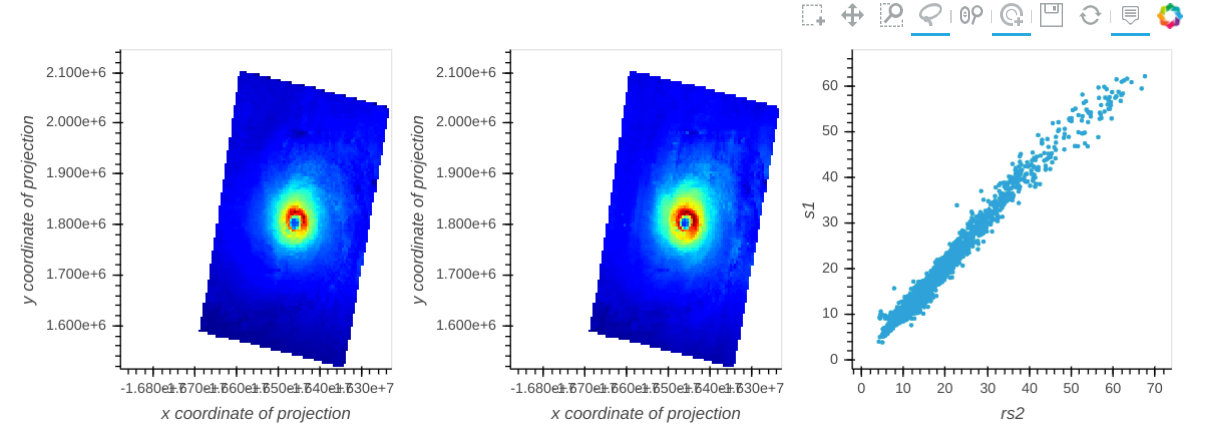
What I want is a working ‘lasso_select’, that will highlight selected points in all plots. I’ve tried to use ‘linked_selection’ from Linked_Brushing, without success.
I’m using
bokeh 2.0.2 and holoviews 1.13.2
Here is the code that show the problem:
! (cd /tmp ; wget -N ftp://ftp.ifremer.fr/ifremer/cersat/datarmor/project/sarwing/users/oarcher/tmp/rs2.nc)
! (cd /tmp ; wget -N ftp://ftp.ifremer.fr/ifremer/cersat/datarmor/project/sarwing/users/oarcher/tmp/s1.nc)

import holoviews as hv
hv.extension('bokeh')
import xarray as xr

# read dataset. They have same coordinates names and value (ie same grid)
ds_s1 = xr.open_dataset('/tmp/s1.nc')
ds_rs2 = xr.open_dataset('/tmp/rs2.nc')

# get wind_speed dataarray
da_s1 = ds_s1['wind_speed']
da_rs2 = ds_rs2['wind_speed']

# two Image
plots = [hv.Image(da).opts(cmap='jet',tools=['hover', 'lasso_select']) for da in [da_rs2,da_s1]]

# add scatter plot, after flatenning ('x','y')
da_rs2_lin = da_rs2.stack(rs2=('x', 'y'))
da_s1_lin  = da_s1.stack(s1=('x', 'y'))
plots.append(hv.Scatter((da_rs2_lin,da_s1_lin),kdims=['rs2'],vdims=['s1']))

# not linked: it works
layout=hv.Layout(plots)
#layout.opts(hv.opts.Image(tools=['hover', 'tap', 'lasso_select']),hv.opts.Scatter(tools=['hover', 'tap', 'lasso_select']))

# no difference using link_selection
from holoviews.selection import link_selections
link_selections(layout,index_cols=['x','y']).opts(hv.opts.Image(tools=['hover', 'tap', 'lasso_select']),hv.opts.Scatter(tools=['hover', 'tap', 'lasso_select']))
What I am missing ?