Hello,
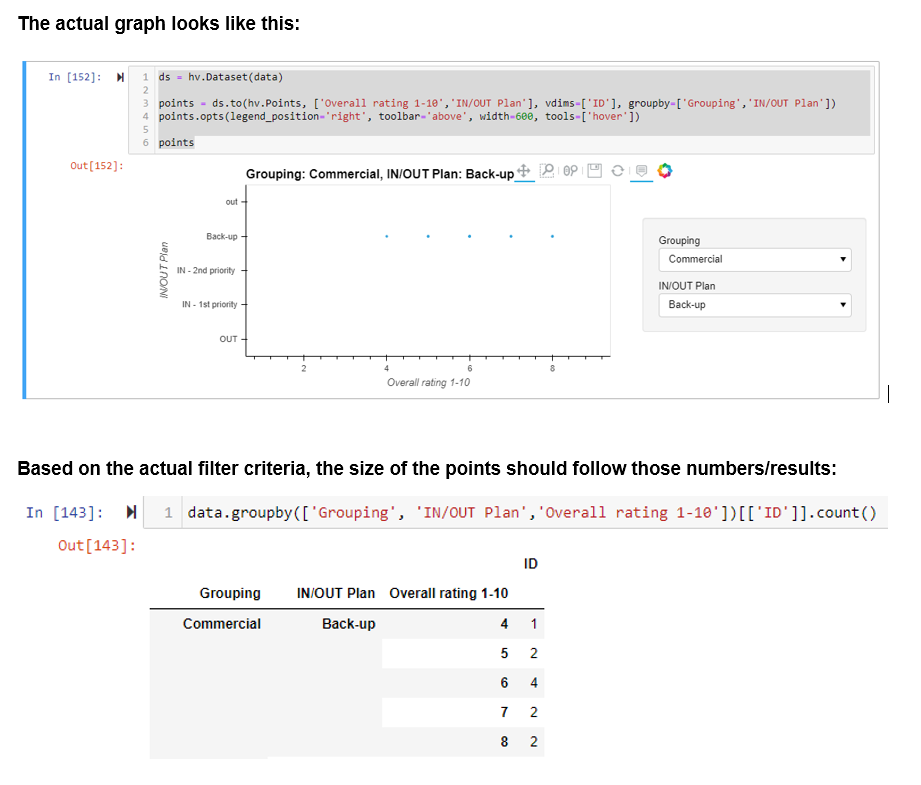
I try to implement a hv.Points graph where the point size should match the count of the groupby criteria.
However, I was not able to find a proper solution.
import numpy as np
import holoviews as hv
import pandas as pd
from holoviews import opts, dim
hv.extension('bokeh')

data = pd.read_excel("test.xlsx")

ds = hv.Dataset(data)

points = ds.to(hv.Points, ['Overall rating 1-10','IN/OUT Plan'], vdims=['ID'], groupby=['Grouping','IN/OUT Plan'])
points.opts(legend_position='right', toolbar='above', width=600, tools=['hover'])

points
PS:
Is there a way to start “unfiltered”, e.g. that all table entries are considered, no grouping across “Grouping” and “IN/Out Plan”?