I have recently been learning holoviews by creating an interactive sonar data viewer that I plan to open-source. It kind-of works, but performs really slowly for interactivity.
Is someone willing to point me in the best direction to look to improve the performance of this code as I am fairly new to holoviews and not sure the best avenue to follow to improve it?
I think I need to use a Link somehow instead of Streams in order to use javascript to interactively modify the graph colour map based on time and draw an arrow based on user interaction of the key, but can’t seem to figure out what building blocks I will need to get this going. I assume I will need some custom javascript on a RangeTool. But looking for any feedback from people with a better understanding of holoviews to avoid wasting too much time heading in the wrong direction. Can you please point me to any relevant reference code / tutorials?
Also any code review / feedback you can give me will help.
Thanks,
Brendon.
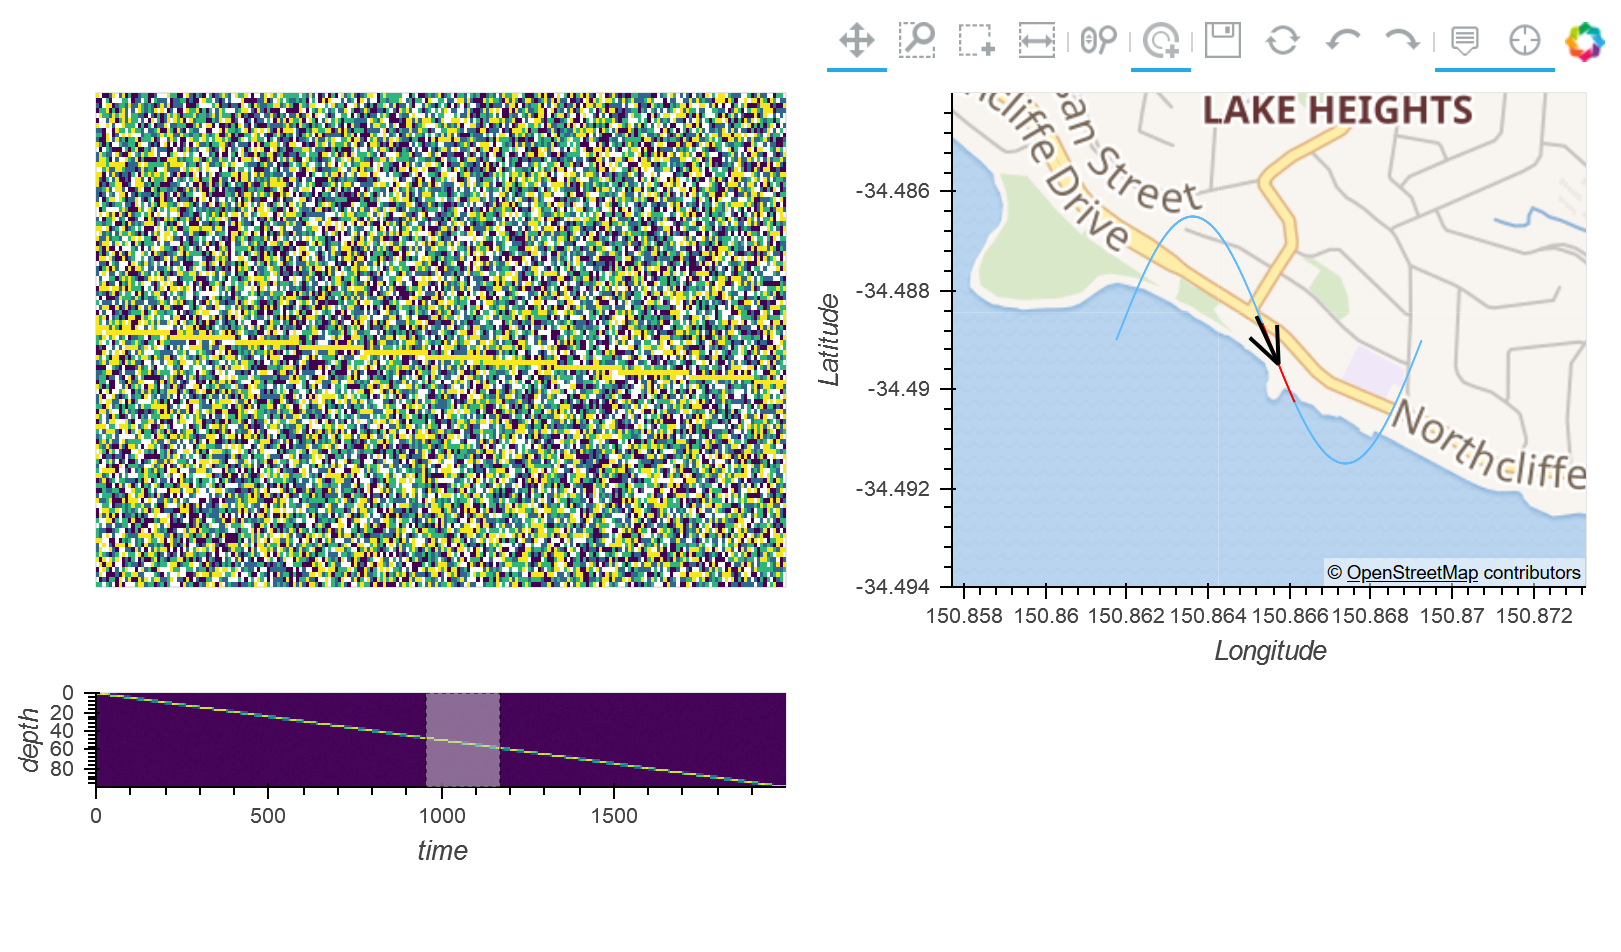
A standalone example of code that achieves roughly what I want but has some rough edges and performs really slowly is attached below. The main interactivity is selecting a range in the smaller key image:
# Setup logging early so we can log time to import etc
import logging
import sys
logger = logging.getLogger('main')
if __name__ == '__main__':
	logging.basicConfig(stream=sys.stdout, level=logging.INFO, format='%(asctime)s : %(message)s')

import numpy.random
import datashader.geo
import holoviews.operation.datashader
import holoviews
import holoviews.streams
import time
import math
import xarray
import random
import numpy

WIDTH = 400
HEIGHT = 300
KEY_HEIGHT = 100


# Configure the default renderer
holoviews.extension('bokeh')
renderer = holoviews.renderer('bokeh').instance(mode='server')


#-----------------------------------------
# Dataset
#-----------------------------------------
def GetData():
	DATA_POINTS = 2000
	MAX_DEPTH = 100
	SONAR_BINS = MAX_DEPTH

	# @todo tiles resizes axis to make tile images not be stretched, we need the bounds of the tiles to use for graph calc
	# Defined longitude/latitude values in WGS84 format
	lon_min, lat_min = (150.858, -34.494)
	lon_max, lat_max = (150.873, -34.484)

	# Convert to northings/eastings in meters required to match the Tiles for overlay
	# and we will work in these units as it is easier than converting all the time
	left, bottom = datashader.geo.lnglat_to_meters(lon_min, lat_min)
	right, top = datashader.geo.lnglat_to_meters(lon_max, lat_max)

	# Real data comes from a sonar log file, this is just made up to make the example standalone
	time_arr = range (0, DATA_POINTS)
	longitude_arr = []
	latitude_arr = []
	heading_arr = []
	speed_arr = []
	bottom_depth_arr = []
	sonar_data_arr = numpy.random.randint(0, 5, (DATA_POINTS, SONAR_BINS))
	last_x = 0
	last_y = 0
	last_calc_heading = None
	for i in range(0, len(time_arr)):
		ratio = i / float(len(time_arr))

		# Standalone data will create a linear depth change from 0 - 20m
		bottom_depth = ratio * MAX_DEPTH
		bottom_depth_arr.append(bottom_depth)
		sonar_data_arr[i][int(bottom_depth)] = 200 + random.randint(0, 55)

		# Lets create a sinsoid path on the map for this standalone data example
		x_ratio = ratio
		x = left + ((right - left) / 4) + (x_ratio * (right - left) / 2)
		longitude_arr.append(x)

		y_ratio = (math.sin(ratio * 2 * math.pi) + 1) / 2.0
		y = bottom + ((top - bottom) / 4) + (y_ratio * (top - bottom) / 2)
		latitude_arr.append(y)

		calc_heading = math.pi / 2.0
		if last_calc_heading is not None:
			# From wikipedia: https://en.wikipedia.org/wiki/Polar_coordinate_system#Converting_between_polar_and_Cartesian_coordinates
			dx = x - last_x
			dy = y - last_y
			heading_r = math.sqrt((dx * dx) + (dy * dy))

			if heading_r == 0: calc_heading = last_calc_heading
			elif y >= 0: calc_heading = math.acos(dx / math.pi)
			else: calc_heading = -1 * math.acos(dx / math.pi)

		last_x = x
		last_y = y
		last_calc_heading = calc_heading

		heading_error = (random.randint(0, 100) - 50) / 200.0
		heading = calc_heading + heading_error
		heading_arr.append(heading)

		speed = random.randint(0, 100)
		speed_arr.append(speed)

	channel = xarray.Dataset({
			'bottom_depth': (['time'], bottom_depth_arr, {'units': 'depth meters'}),
			'longitude': (['time'], longitude_arr),
			'latitude': (['time'], latitude_arr),
			'heading': (['time'], heading_arr),
			'speed': (['time'], speed_arr),
			'amplitudes': (['time', 'depth'], sonar_data_arr, {'units': 'amplitude'}),
		},
		coords={
			'time': (['time'], time_arr),
			'depth': (['depth'], range(0,MAX_DEPTH)),
		},
		attrs={
			'graph_longitude_min': left,
			'graph_longitude_max': right,
			'graph_latitude_min': bottom,
			'graph_latitude_max': top,
		})

	return channel


def CreateTiles(channel):
	tiles = holoviews.Tiles('https://maps.wikimedia.org/osm-intl/{Z}/{X}/{Y}@2x.png', name="Wikipedia")
	tiles = tiles.opts(width=WIDTH, height=HEIGHT)

	# Adjust the framing of the tile to show the frame and not the entire world
	# From: https://examples.pyviz.org/nyc_taxi/nyc_taxi.html
	x_dim = holoviews.Dimension('x', label='Longitude', range=(channel.attrs['graph_longitude_min'], channel.attrs['graph_longitude_max']))
	y_dim = holoviews.Dimension('y', label='Latitude', range=(channel.attrs['graph_latitude_min'], channel.attrs['graph_latitude_max']))
	tiles = tiles.redim(x=x_dim, y=y_dim)

	# @todo We should export the tile extents as they dont match exactly the channel.attrs['graph_latitude_max'] min/max lat/lon with the values in all cases
	return tiles

def CreateSonarImage(channel):
	# Create the pre-rasterized low res preview image used as the selection tool for data to show
	# @todo Need a better way instead of transposing dimensions
	amplitudes = channel.amplitudes.transpose('depth', 'time')
	large_image = holoviews.Image((channel.time, channel.depth, amplitudes), datatype=['grid'], kdims=['time', 'depth'], vdims=['amplitude'])
	return large_image

def CreateSonarDetail(channel, sonar_image):
	# Create a detailed image showing sonar data at  user selected zoom
	detail = holoviews.operation.datashader.datashade(sonar_image, cmap=datashader.colors.viridis)
	detail = detail.opts(width=WIDTH, height=HEIGHT, xaxis=None, yaxis=None, invert_yaxis=True,
	tools=['hover', 'xpan', 'xwheel_zoom', 'crosshair', 'xbox_zoom', 'undo', 'redo', 'save']
	)
	return detail

def CreateSonarKey(channel, sonar_image):
	key = holoviews.operation.datashader.rasterize(sonar_image, width=WIDTH, height=KEY_HEIGHT, precompute=True)
	key = key.opts(width=WIDTH, height=KEY_HEIGHT, cmap='viridis', logz=False, invert_yaxis=True,
	default_tools=[],
	tools=['xbox_select', 'undo', 'redo', 'save']
	)
	return key

def CreatePath(channel, x_range=None):
	# @todo Surely we can use xarray properly here somehow without creating a new path_points array
	path_points = []

	for i in range(0, len(channel.time)):
		path_points.append((
			channel.longitude[i].values.item(),
			channel.latitude[i].values.item(),

			# @todo Ideally we would use some kind of javascript to change the colour pallette of all paths based on the associated time instead of re-creating the whole Path below
			channel.time[i].values.item(),

			# @todo Ideally we would be able to use heading and speed data here in javascript to draw an arrow at a selected point instead of redrawing everything below
			channel.heading[i].values.item(),
			channel.speed[i].values.item()
			))

	path = holoviews.Path(
		path_points,
		kdims=[
			holoviews.Dimension('easting'),
			holoviews.Dimension('northing')],
		vdims=['time', 'heading', 'speed'])

	if x_range is not None:
		levels = [0,
			x_range[0],
			x_range[1],
			len(channel.time)]
		colors = ['#5ebaff', '#ff0000', '#5ebaff']
		path = path.opts(color='time', color_levels=levels, cmap=colors)
	return path

def CreateArrow(channel, x_range=None):
	# @todo Ideally I would like an 'arrow' type marker and use a single Point, but this is a workaround using a Graph

	max_speed = channel.speed.max().item()

	selected_index = 0
	if x_range is not None:
		selected_index = int((x_range[0] + x_range[1]) / 2)
		logger.info('xrange min:%s, max:%s selected_index:%s', x_range[0], x_range[1], selected_index)
	if selected_index >= len(channel.time):
		logger.warning('Bad si: %s expected <: %s', selected_index, len(channel.time))
		selected_index = len(channel.time) - 1

	x = channel.longitude[selected_index].values.item()
	y = channel.latitude[selected_index].values.item()
	heading = channel.heading[selected_index].values.item()
	speed = channel.speed[selected_index].values.item()

	x_dist = channel.attrs['graph_longitude_max'] - channel.attrs['graph_longitude_min']
	y_dist = channel.attrs['graph_latitude_max'] - channel.attrs['graph_latitude_min']
	logger.info('dist x:%s, y:%s', x_dist, y_dist)

	# Draw arrow from x,y using polar coords heading and speed for size
	# Issue is the size will be diff on x,y axis as they cover different range
	speed_percentage = speed * 100 / max_speed
	logger.info('speed_percentage:%s speed: %s, heading: %s', speed_percentage, speed, heading)

	# Ratio of whole graph range (x_dist, y_dist)
	min_arrow_ratio = 0.05
	max_arrow_ratio = 0.5
	logger.info('arrow_ratio min:%s, max:%s', min_arrow_ratio, max_arrow_ratio)

	# Need to account for pixels size of graph as well
	y_mult = float(HEIGHT) / float(WIDTH)

	avail_x_dist = (x_dist * max_arrow_ratio * speed_percentage / 100) - (x_dist * min_arrow_ratio * speed_percentage / 100)
	avail_y_dist = (y_dist * max_arrow_ratio * speed_percentage / 100 * y_mult) - (y_dist * min_arrow_ratio * speed_percentage / 100 * y_mult)
	logger.info('avail_dist x:%s, y:%s', avail_x_dist, avail_y_dist)

	x_ratio = math.cos(heading)
	y_ratio = math.sin(heading)
	logger.info('vector ratio x:%s, y:%s', x_ratio, y_ratio)

	x_size = x_ratio * avail_x_dist
	y_size = y_ratio * avail_y_dist
	logger.info('size x:%s, y:%s', x_size, y_size)

	x = [x, x-x_size, channel.attrs['graph_longitude_min'], channel.attrs['graph_longitude_max']]
	y = [y, y-y_size, channel.attrs['graph_latitude_min'], channel.attrs['graph_latitude_max']]
	node_indexes = [0,1,2,3]
	nodes = holoviews.Nodes((x, y, node_indexes, node_indexes))
	source,target = [1],[0]
	arrow = holoviews.Graph(((source, target, ), nodes, ))
	arrow = arrow.opts(directed=True, node_size=0, arrowhead_length=min_arrow_ratio)
	arrow = arrow.opts(width=WIDTH, height=HEIGHT)
	return arrow

def Main():
	def OnKeyChangeGenerateMap(x_range):
		path = CreatePath(channel, x_range)
		arrow = CreateArrow(channel, x_range)
		return holoviews.Overlay([tiles, path, arrow])

	channel = GetData()
	tiles = CreateTiles(channel)
	sonar_image = CreateSonarImage(channel)
	sonar_detail = CreateSonarDetail(channel, sonar_image)
	sonar_key = CreateSonarKey(channel, sonar_image)

	# Create a DynamicMap able to display path + heading and speed on the map
	range_stream = holoviews.streams.RangeX(source=sonar_detail)
	map = holoviews.DynamicMap(OnKeyChangeGenerateMap, streams=[range_stream])

	# Declare a RangeToolLink between the x-axes of the two plots
	detail_link = holoviews.plotting.links.RangeToolLink(sonar_key, sonar_detail, axes=['x'])


	graph = holoviews.Layout([sonar_detail, map, sonar_key]).cols(2).opts(holoviews.opts.Layout(shared_axes=False))
	# Display interactive
	from bokeh.server.server import Server
	from tornado.ioloop import IOLoop
	app = renderer.app(graph)
	server = Server({'/': app}, port=0)
	server.start()
	server.show('/')
	loop = IOLoop.current()
	loop.start()

if __name__ == '__main__':
	Main()