Hello,
I have been trying to do bio image analysis visualizations with holoviz but so far no luck importing bio formats to get the kind of visualizations you get with parq dataset. I have a minimal example where I am reading in a tif file with rasterio having shape (T,Y,X). After that I create a two dimensional image by taking the fist time point and have a csv file of T,Y,X locations from which I choose the Y,X locations at T = 1, I try to open this in dashboard by following the scipy tutorials that worked with parq dataset but I get errors that I do not understand what they mean.
Here is my notebook that details my steps and I am looking for a working example with tif files that can import some locations from a csv file to show it along with the input image.
Example notebook of tif file as input
Hi,
I tried the example with my tif file, it still gives me errors. I think that your and my tif file format are a bit different. As an example I am uploading my tif file and a csv file that goes with it.
Can you please try the example with these as I can not understand the errors I get with my tif format, which is pretty standard in bio image analysis.
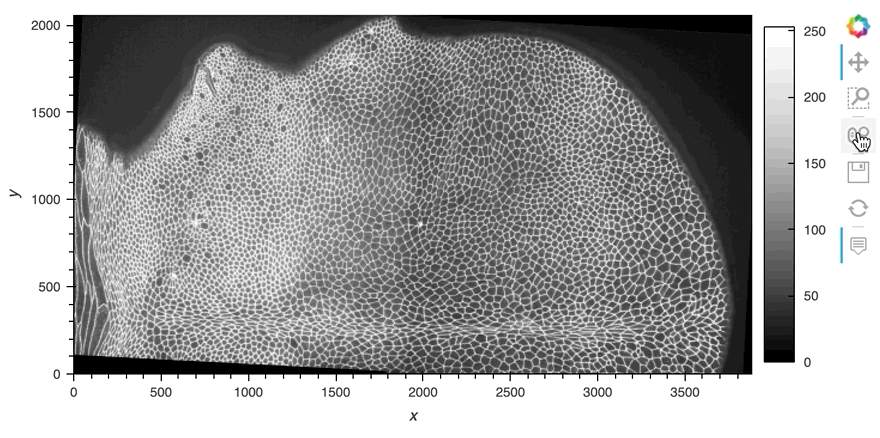
Here’s an example, hope this helps:
import xarray as xr
import hvplot.xarray

ds = xr.open_rasterio('/Users/philippjfr/Downloads/wt_mov12_SW30_0001.tif')
ds.sel(band=1).hvplot.image(cmap='Greys_r', rasterize=True, data_aspect=1)
3 Likes
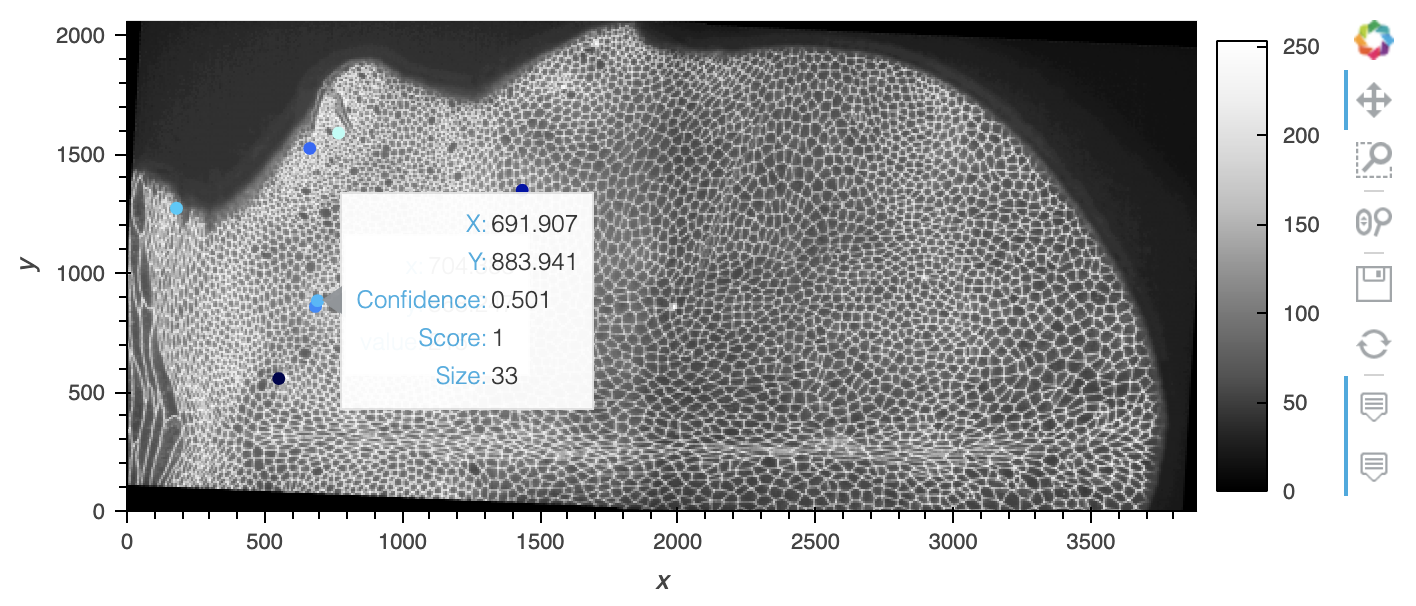
Oh and here’s an overlay with the points:
import xarray as xr
import hvplot.xarray
import hvplot.pandas
import pandas as pd

ds = xr.open_rasterio('/Users/philippjfr/Downloads/wt_mov12_SW30_0001.tif')
df = pd.read_csv('/Users/philippjfr/Downloads/example (1).csv')

ds.sel(band=1).hvplot.image(cmap='Greys_r', rasterize=True) *\
df.hvplot.points('X', 'Y', color='Confidence', hover_cols=['Score', 'Size'])
2 Likes
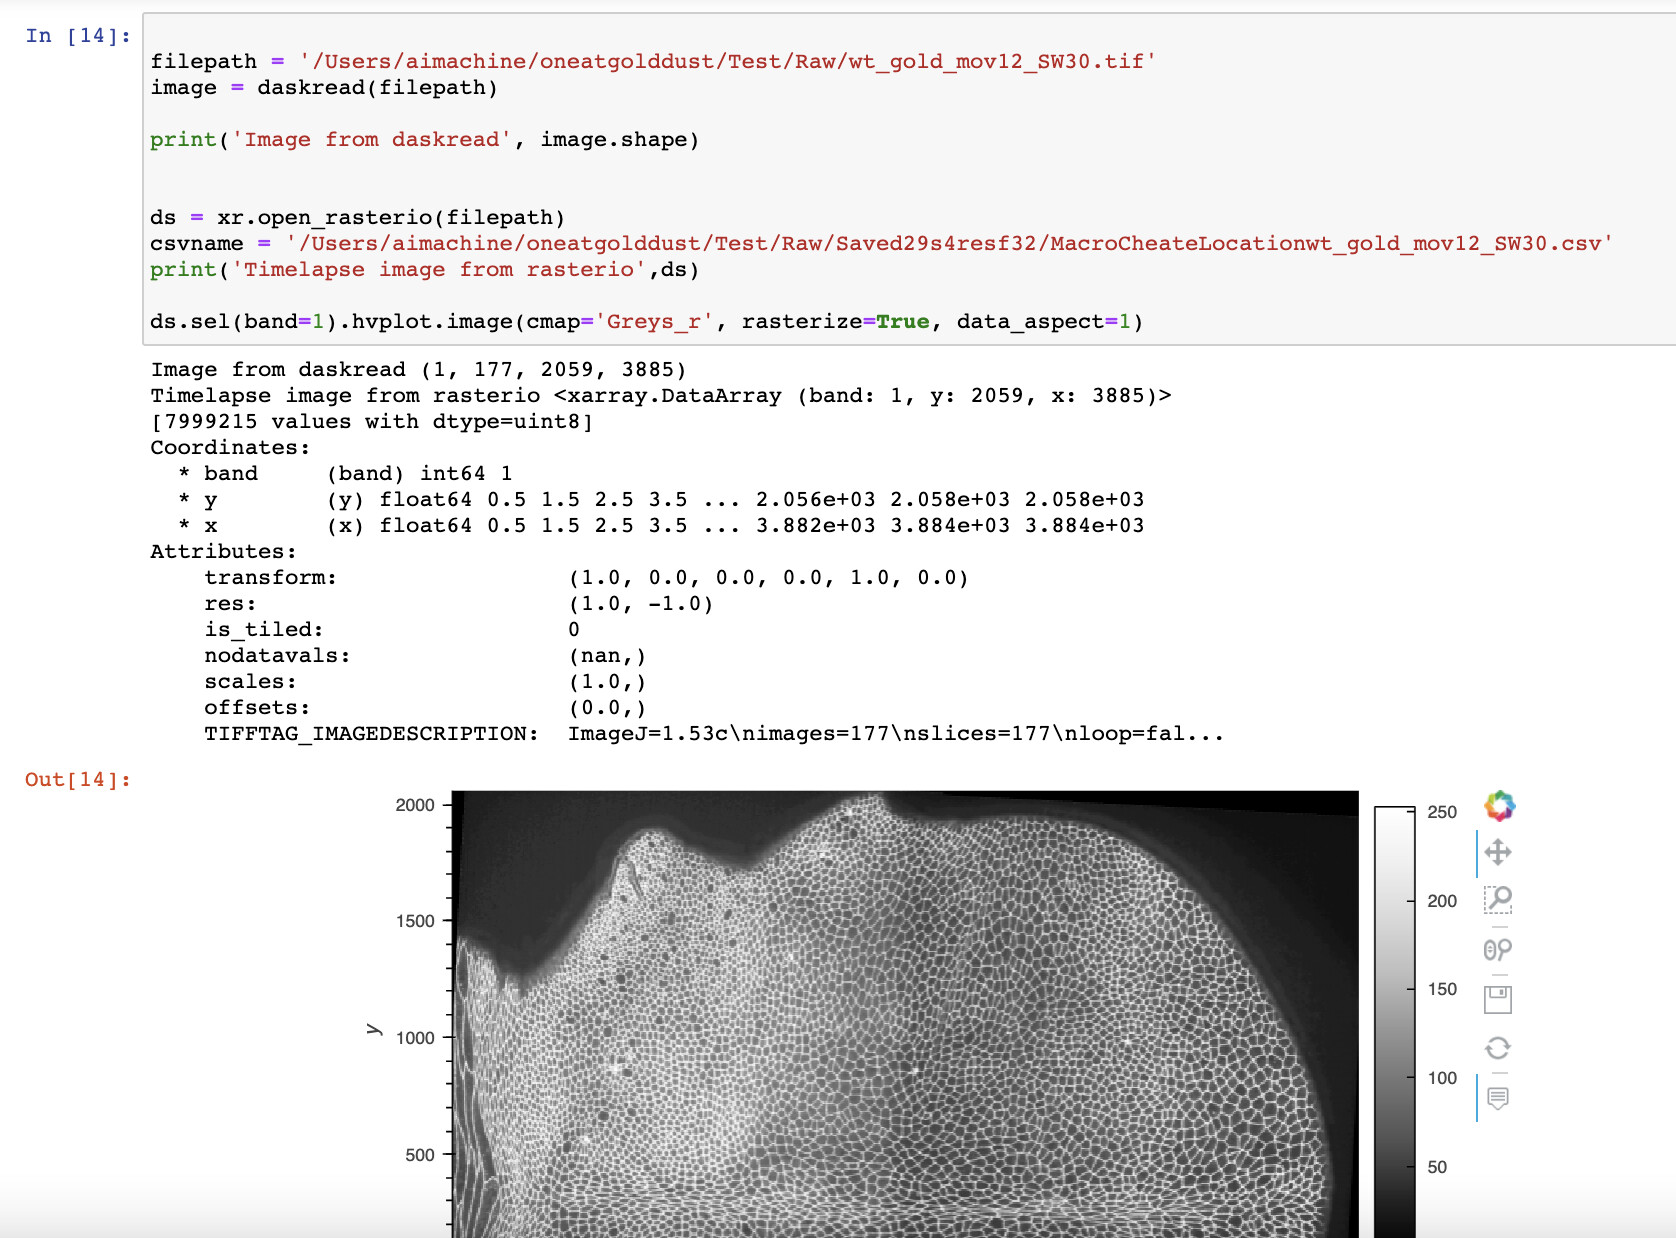
@philippjfr Many thanks for this, now I seem to understand that bands are the same as channels in a tif file. So this worked for me as well. Then I wanted to load in a 4 dimensional image of the shape (1,177,2049,3885) which imaread of tifffile or daskread would load properly, however rasterio only loads it as (1,2049,3885). Is there a way to read in such 4 dimensional image via filepath directly or if I can load it in first as a numpy array and then convert it to xarray? Am attaching my screenshot:
Thanks a lot again.
That sounds like a rasterio rather than holoviz question.
A quick google search showed me examples of mainly RGB tifs but nothing much about timelapses, I can try cheating and convert the image into CYX instead of CTYX, save n open and that would be one unclean way of doing it but I will keep searching for more clean way meanwhile too. Thanks a lot for your help.
We should definitely start a discussion for configurable tiff file readers in xarray if rasterio doesn’t handle CTYX stacks properly.
1 Like
Could you make the CTYX tiff file available for testing?
1 Like
Hi, I have uploaded a file of mouse embryo which is a ZYX file, I tried the rasterio on this file as well and it is the same result, it is read in as a single channel YX image. You can find it for testing over here:
Example tif file for testing
@philippjfr I uploaded the dataset on zendoo. I will also open a github issue on their page to see if they have an idea about troubleshooting it.