Horizontal lines in boxwisker plot

Hello,

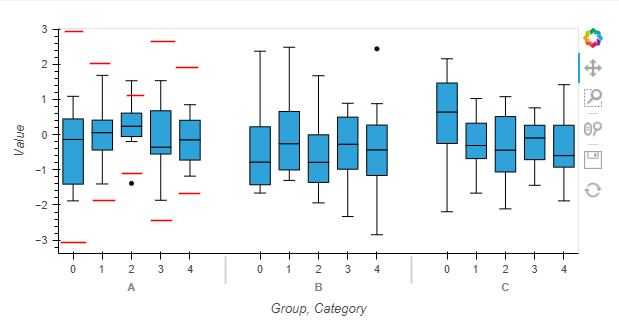
I would like to add horizontal line to a boxwisker plot. See red lines in example afbeelding

These are specification lines.

With Matplotlib I could add them by drawing a horizontal line and using the horizontal axis category for the horizontal length. How can I achieve the same with HoloViews?

Johnny

1 Like

Hi @JohGel

Could you provide a minimum reproducible example of the boxwisker plot?

Alternatively you can maybe use segments Segments β€” HoloViews 1.14.5 documentation and overlay them on the boxwisker plot using * notation. See Composing Elements β€” HoloViews 1.14.5 documentation

Hello @Marc ,

Thanks for the suggestion of using segments. I will take a look at it.

My screenshot is made by adding lines using a drawing program on top of the picture from the boxwisker document page.

Maybe I can create a reproducible example when this works with the segments.

Johnny

1 Like

Hello @Marc ,

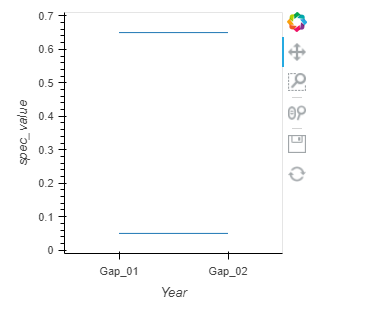
I experimented with the hv.Segments, see screenshot. afbeelding

It’s almost what I want. I want the line to be centered at the category, X-axis tick. But the start and end of the segment is a category name. Is it possible to shift the line to the left?
Used code below.

LSL=0.05
USL=0.65
NOM=0.3
spec_value=[LSL, USL]

data = dict(
    start=['Gap_01', 'Gap_01'],
    end=['Gap_02','Gap_02'],
    start_event = spec_value,
    end_event = spec_value
)


specline2=hv.Segments(data, [hv.Dimension('start', label='Year'), 
                         hv.Dimension('start_event', label='spec_value'), 'end', 'end_event'],

                     )
 
specline2