I looked here: http://holoviews.org/reference/elements/bokeh/Spikes.html and in hv.help(hv.Spikes) but I cannot find a good explanation of how to use spikes for horizontal lines.
How can I do that?
Thanks
I looked here: http://holoviews.org/reference/elements/bokeh/Spikes.html and in hv.help(hv.Spikes) but I cannot find a good explanation of how to use spikes for horizontal lines.
How can I do that?
Thanks
Using invert_axes=True is one way of doing this:
(scatter_plot * spikes).opts(invert_axes=True)
The trick is then to put the column you want on the y_axis first on the x_axis and then later invert the axis.
Don’t know if there’s a way to just specify to which axes the spikes should be added. But I would say most use cases would be with timelines on the x-axis and less with the y-axis.
Example code:
# import libraries
import pandas as pd
import holoviews as hv
hv.extension('bokeh')

# create some sample data
df = pd.DataFrame({
    'col_X': [3, 4, 5, 6],
    'col_Y': [5, 6, 7, 8],
})

# create scatter plot knowing you are going invert it later
# so on purpose I put the y column on the x axis
scatter_plot = hv.Scatter(
    df, 'col_Y', 'col_X',
).opts(xlim=(0, None), size=10)

# create spikes
spikes = hv.Spikes(
    df['col_Y'],
).opts(
    spike_length=2.0,
    line_width=2.0,
    line_dash='dashed',
    color='blue',
)

# create layout of scatterplot and spikes and invert the axes
(scatter_plot * spikes).opts(invert_axes=True)
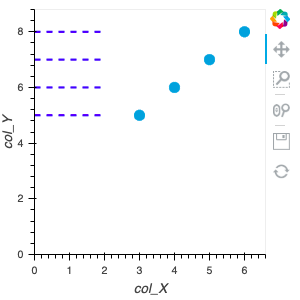
Resulting plot: