In order to show exactly what’s going on, I’ll provide some sample code. This is the .py file that I exported through the Jupyter-Lab interface:
#!/usr/bin/env python
# coding: utf-8

# In[1]:

import os
import xarray as xr
import hvplot.xarray
import pandas as pd
import panel as pn
import intake

# In[2]:

Regs = ['gl', 'hn', 'tr', 'hs', 'as']
Exps = ['BAMH']
Stats = ['VIES', 'RMSE', 'MEAN']

data = '20230216002023030300'

# In[3]:

catalog = intake.open_catalog('https://raw.githubusercontent.com/cfbastarz/panel_tests/main/catalog.yml')

# In[4]:

ds1 = catalog.scantec_gl_rmse_dtc.to_dask()

# In[5]:

ds1

# In[6]:

Vars = list(ds1.variables)
Vars.remove('time')
Vars.remove('lat')
Vars.remove('lon')

variable_list = Vars
variable = pn.widgets.Select(name='Variable', value=variable_list[0], options=variable_list)

region = pn.widgets.Select(name='Region', value=Regs[0], options=Regs)
experiment = pn.widgets.Select(name='Experiment', value=Exps[0], options=Exps)
statistic = pn.widgets.Select(name='Statistic', value=Stats[0], options=Stats)

test_list = ['ref_GFS', 'ref_Era5', 'ref_PAnl']
test = pn.widgets.Select(name='Reference', value=test_list[0], options=test_list)

@pn.depends(variable, region, experiment, statistic, test)
def plotFields(variable, region, experiment, statistic, test):
    if test == 'ref_GFS': ttest = 'T1'
    if test == 'ref_Era5': ttest = 'T2'
    if test == 'ref_PAnl': ttest = 'T3'
    lfname = 'scantec_' + region.lower() + '_' + statistic.lower() + '_' + experiment.lower()
    dfs = catalog[lfname].to_dask()
    cmin=dfs[variable].min()
    cmax=dfs[variable].max()
    cmap='tab20c_r'
    if region == 'as':
        frame_width=500
    else:
        frame_width=960
    ax = dfs[variable].hvplot(groupby='time', clim=(cmin, cmax), widget_type='scrubber', widget_location='bottom',
                              frame_width=frame_width, cmap=cmap)
    return pn.Column(ax, sizing_mode='stretch_width')

card_parameters = pn.Card(variable, region, experiment, statistic, test, title='Parameters', collapsed=False)

settings = pn.Column(card_parameters)

pn.template.FastListTemplate(
    site="My Dashboard", title="panel_tests", sidebar=[settings],
    main=["My test.", plotFields],
#).show();
).servable();
The code is pretty simple. I use the intake to load a catalog file, which contains data sources in the Zarr format.
At this point, I’m just trying to show a spatial field in the panel app (I didn’t even correctly projected the data to avoid other issues). So, I guess the approach of loading the data by using the intake catalog is ok, altough the loading time is pretty long (I guess it can be improved by rechunking the dataset?).
I’m trying to deploy the panel app at GitHub pages (my repo is GitHub - cfbastarz/panel_tests) and I successfully did it before, but using only CSV data that I hosted along with the panel files in the repository. When I try to load the panel (here’s the url panel_tests), this is what I get:
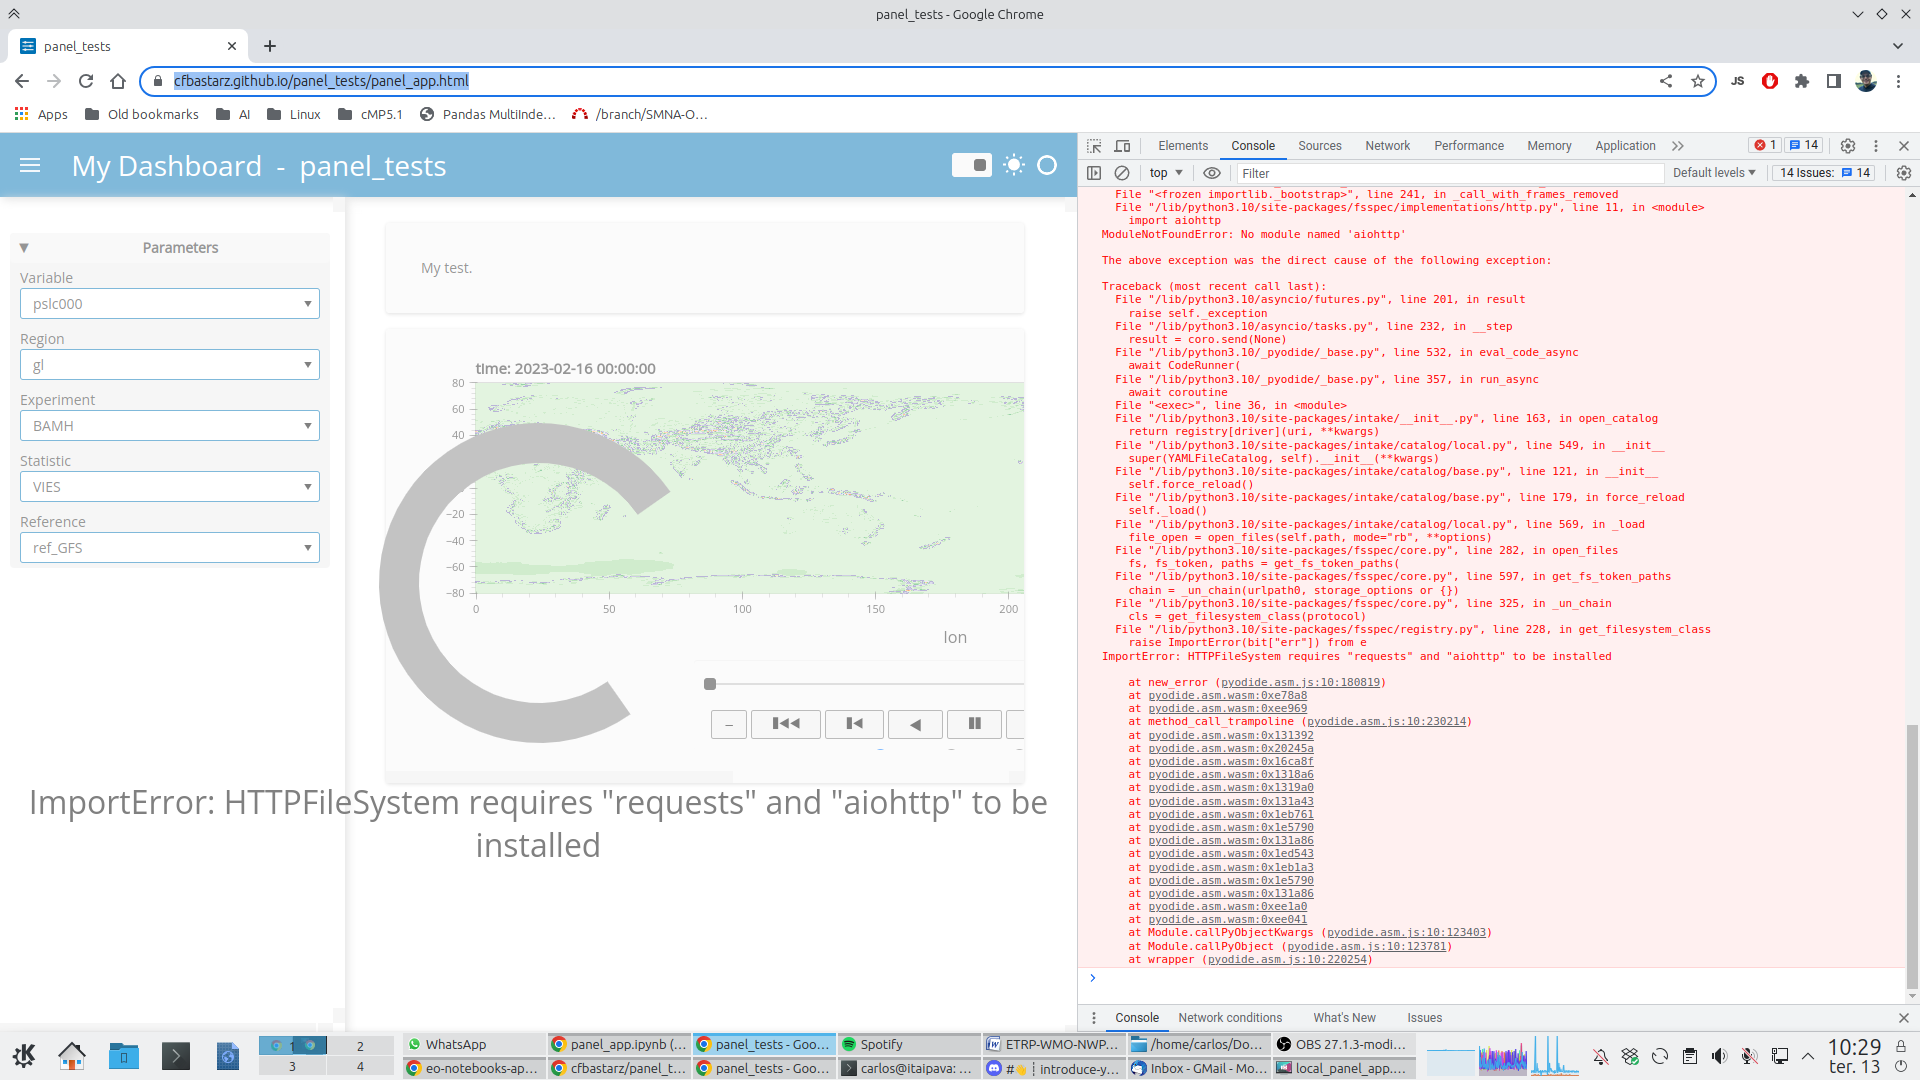
This is what I get after I manually include the requests and aiohttp packages inside the panel_app.js file.
So, is this panel app supposed to work the way it is or there is something missing or it is just the way I’m doing things? Any suggestions and guidance is greatly appreciated.
Cheers,
Carlos