Dear community,
I need your help ![]()
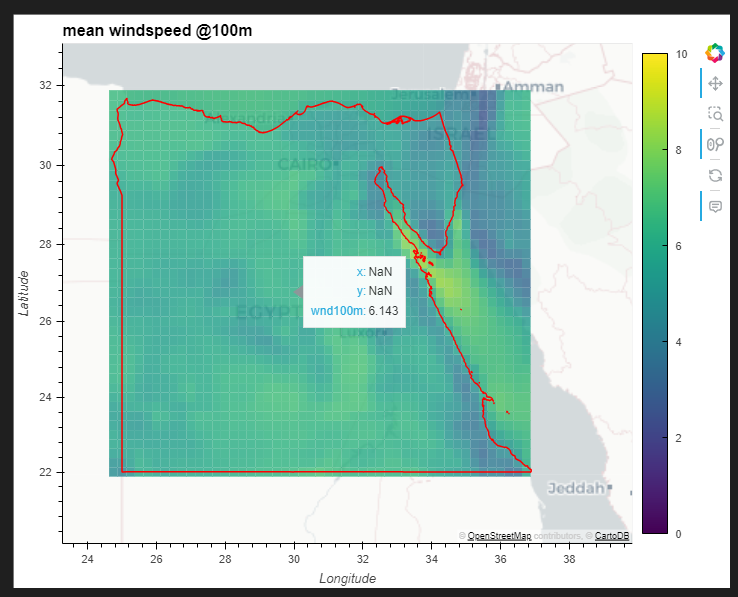
I am using hvplot.quadmesh to visualize wind speed data.
The hover tool should show the x and y coordinates of the pixels, but it only shows “NaN”.
#interactive plot mean wind speed over whole year for each pixel
wnd100mean = cutout.data.wnd100m.mean(dim="time")

quadmesh_plot = wnd100mean.hvplot.quadmesh(
    "x",
    "y",
    "wnd100m",
    frame_height=500,
    cmap="viridis",
    geo=True,
    tiles="CartoLight",
    alpha=0.8,
    padding=0.5,
    clim=(0, 10),
    title='mean windspeed @100m',
    hover_cols=['x', 'y', 'wnd100m'],  # Include x, y, and wind speed in hover
)

polygon_plot1 = country.hvplot(
    geo=True,
    line_color='red',        # Set color of polygons, e.g., red
    fill_alpha=0,          # Transparency level of polygons
    line_width=1.5,     # Line width for borders of polygons
)


# Overlaying the quadmesh plot with the polygon plot
overlay = quadmesh_plot * polygon_plot1

# Display the final overlay plot
overlay
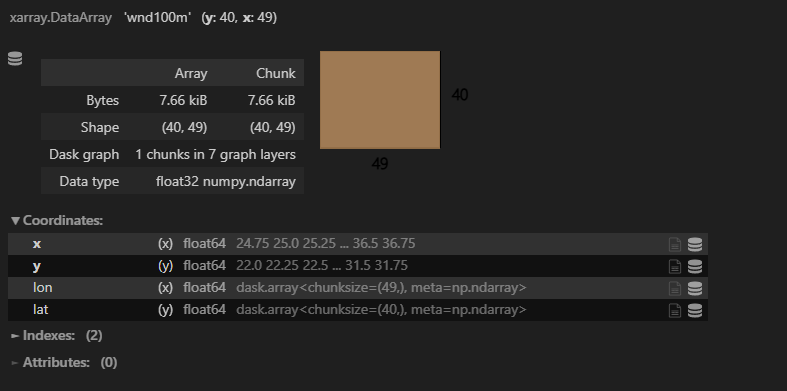
wnd100mean looks like that:
the hover showing x and y as NaN: