How best to reload dataset shown in a Panel Dashboard?

Panel is great at making simple dashboards to explore met/ocean forecast model output, like this HRRR explorer notebook, where I open an OPeNDAP Data URL from Unidata’s THREDDS server with xarray:

url = 'http://thredds.ucar.edu/thredds/dodsC/grib/NCEP/HRRR/CONUS_2p5km/Best'
ds = xr.open_dataset(url, chunks={'time':1})

load data and display fields using hvplot:

@pn.depends(var_select, base_map_select)
def plot(var, base_map):
    extra_dims = list(ds[var].dims[:-2])
    mesh = ds[var].hvplot.quadmesh(x='x', y='y', rasterize=True, crs=crs, title=var,
                                   attr_labels=False, project=True,
                                   groupby=extra_dims, cmap='rainbow',
                                   width=600, height=400).opts(alpha=0.7,
                                   data_aspect=None, active_tools=['wheel_zoom', 'pan'])
    return pn.panel(mesh * base_map, widgets={k: pn.widgets.Select for k in extra_dims})

col = pn.Column(var_select, base_map_select, plot)

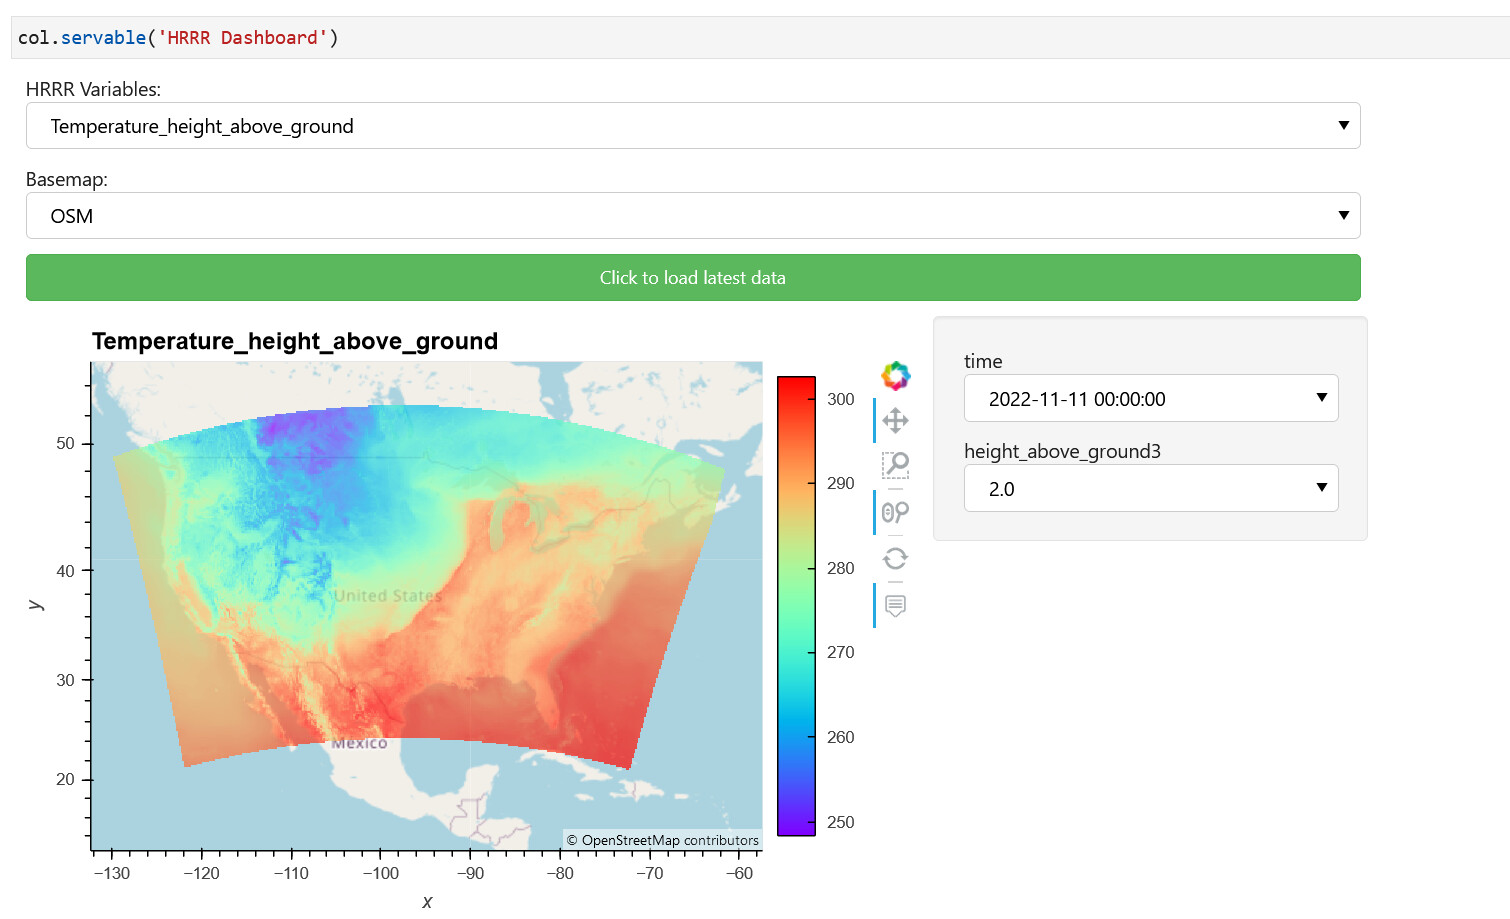
Here’s a snapshot of the dashboard:

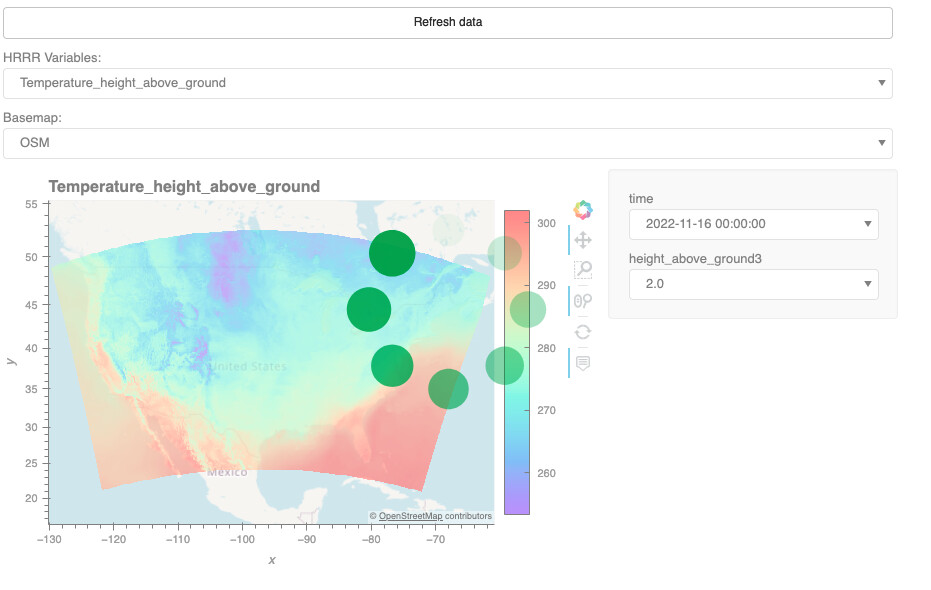
The data available at the OPeNDAP endpoint changes each time a new forecast is available, but unless we reload the dataset, xarray won’t know about the new data. This isn’t a problem if the user just reruns the notebook, but when deployed as a web app that stays running, I guess I need a button that says “check for latest data” that reloads the dataset?

How best to accomplish that?

1 Like

Could have a callback to regularly check for updates in the background and then apply.

Ultimately, I’d love if xarray had streaming capabilities similar to streamz though…

Depending upon how you deploy it as a web app, you might want to use a server local cache for the data. panel serve allows for a script that runs at a periodic interval, that could update the cache and also have periodic callbacks to update the dash

Ooh, that sounds promising! What is the best documentation (or example) of this?
(I googled around, but didn’t figure it out)

pn.state.add_periodic_callback should do it, though I can’t find an authoritative spot for that in the docs.

I think pn.state.schedule_task allows you to update a global dataset

https://panel.holoviz.org/user_guide/Session_State_and_Callbacks.html


I decided that rather than having something scheduled, I would just like a button that when pressed, would reload the dataset from the thredds server, which would pick up any new data.

I have a plot command that looks like this:

@pn.depends(var_select, base_map_select)
def plot(var, base_map):
    ds = xr.open_dataset(url, chunks={'time':1})
    ds  = ds.metpy.parse_cf()    
    extra_dims = list(ds[var].dims[:-2])
    mesh = ds[var].hvplot.quadmesh(x='x', y='y', rasterize=True, crs=crs, title=var,
                                   attr_labels=False, project=True,
                                   groupby=extra_dims, cmap='rainbow',
                                   width=600, height=400).opts(alpha=0.7,
                                   data_aspect=None, active_tools=['wheel_zoom', 'pan'])
    return pn.panel(mesh * base_map, widgets={k: pn.widgets.Select for k in extra_dims})

And I added a button with a callback that updates the objects:

def b(event):
    col.objects = pn.Column(var_select, base_map_select, button, plot).objects
    
button.on_click(b)

I was thinking that updating all the objects would update the dataset, as long as the dataset load is in the plot object.

But although I can see that the plot is redrawn, the dataset doesn’t seem to be reloaded.

Any ideas how to fix this?

The full reproducible (good for a gallery!) notebook is here: Jupyter Notebook Viewer

Screenshot:

Hi @rsignell

I tried to look at the example but does not have the rights to download the data from the url.

But I think you need to change your code such that the button does not have a callback handler. Instead the plot should depend on the button too.

@pn.depends(var_select, base_map_select, button)
def plot(var, base_map, event):
1 Like

The suggestion made by @Marc is indeed correct, you can make plot depend on a button widget and it will be re-executed every time you click on the button. .on_click is just another way to register a callback on a button.

In this example I’ve made two additional changes:

  • assumed the list of variables could be dynamic, so I wrapped the code that downloads the dataset and instantiates the variable selector in a map_select function, that is re-executed on every button click.
  • set loading_indicator=True to get a loading spinner when the button is refreshed or one of the widgets value is changed (note it doesn’t apply to the coordinates widgets, they’re handled by HoloViews which I think doesn’t offer a loading spinner):
import hvplot.xarray
import holoviews as hv
import metpy
import panel as pn
import xarray as xr

from cartopy import crs as ccrs
from geoviews import tile_sources as gvts

url = 'http://thredds.ucar.edu/thredds/dodsC/grib/NCEP/HRRR/CONUS_2p5km/Best'

update_button = pn.widgets.Button(name='Refresh data')

def plot(ds, crs, var, base_map):
    extra_dims = list(ds[var].dims[:-2])
    mesh = ds[var].hvplot.quadmesh(x='x', y='y', rasterize=True, crs=crs, title=var,
                                   attr_labels=False, project=True,
                                   groupby=extra_dims, cmap='rainbow',
                                   width=600, height=400).opts(alpha=0.7,
                                   data_aspect=None, active_tools=['wheel_zoom', 'pan'])
    return pn.panel(mesh * base_map, widgets={k: pn.widgets.Select for k in extra_dims})

def map_select(event=None):
    ds = xr.open_dataset(url, chunks={'time':1})

    time_vars = []
    for var in ds.data_vars:
        if len(ds[var].dims) > 0:
            if 'time' in ds[var].dims[0] and not 'bounds' in var:
                time_vars.append(var)

    init_var = 'Temperature_height_above_ground'
    ds = ds.metpy.parse_cf()
    crs = ds[init_var].metpy.cartopy_crs

    var_select = pn.widgets.Select(name='HRRR Variables:', options=sorted(time_vars), value=init_var)
    base_map_select = pn.widgets.Select(name='Basemap:', options=gvts.tile_sources, value=gvts.OSM)
    
    plot_app = pn.bind(plot, ds=ds, crs=crs, var=var_select, base_map=base_map_select)
    return pn.Column(
        var_select,
        base_map_select,
        pn.panel(plot_app, loading_indicator=True),
    )

pn.Column(
    update_button,
    pn.panel(pn.bind(map_select, update_button), loading_indicator=True),
)

1 Like

Would it be possible to share a link to the data that is accessible @rsignell, just in case someone wants a working starting point for their own app?

The link was working for me.

I get

Error:curl error: Problem with the SSL CA cert (path? access rights?)
curl error details: 
Warning:oc_open: Could not read url
Traceback (most recent call last):
  File "/home/jovyan/repos/private/panel-gallery/.venv/lib/python3.10/site-packages/xarray/backends/file_manager.py", line 209, in _acquire_with_cache_info
    file = self._cache[self._key]
  File "/home/jovyan/repos/private/panel-gallery/.venv/lib/python3.10/site-packages/xarray/backends/lru_cache.py", line 55, in __getitem__
    value = self._cache[key]
KeyError: [<class 'netCDF4._netCDF4.Dataset'>, ('http://thredds.ucar.edu/thredds/dodsC/grib/NCEP/HRRR/CONUS_2p5km/Best',), 'r', (('clobber', True), ('diskless', False), ('format', 'NETCDF4'), ('persist', False)), 'eaac8a2e-2917-4b25-ae43-2eb387dbf238']

During handling of the above exception, another exception occurred:

Traceback (most recent call last):
  File "/home/jovyan/repos/private/panel-gallery/script.py", line 3, in <module>
    ds = xr.open_dataset(url, chunks={'time':1})
  File "/home/jovyan/repos/private/panel-gallery/.venv/lib/python3.10/site-packages/xarray/backends/api.py", line 539, in open_dataset
    backend_ds = backend.open_dataset(
  File "/home/jovyan/repos/private/panel-gallery/.venv/lib/python3.10/site-packages/xarray/backends/netCDF4_.py", line 572, in open_dataset
    store = NetCDF4DataStore.open(
  File "/home/jovyan/repos/private/panel-gallery/.venv/lib/python3.10/site-packages/xarray/backends/netCDF4_.py", line 376, in open
    return cls(manager, group=group, mode=mode, lock=lock, autoclose=autoclose)
  File "/home/jovyan/repos/private/panel-gallery/.venv/lib/python3.10/site-packages/xarray/backends/netCDF4_.py", line 323, in __init__
    self.format = self.ds.data_model
  File "/home/jovyan/repos/private/panel-gallery/.venv/lib/python3.10/site-packages/xarray/backends/netCDF4_.py", line 385, in ds
    return self._acquire()
  File "/home/jovyan/repos/private/panel-gallery/.venv/lib/python3.10/site-packages/xarray/backends/netCDF4_.py", line 379, in _acquire
    with self._manager.acquire_context(needs_lock) as root:
  File "/opt/conda/lib/python3.10/contextlib.py", line 135, in __enter__
    return next(self.gen)
  File "/home/jovyan/repos/private/panel-gallery/.venv/lib/python3.10/site-packages/xarray/backends/file_manager.py", line 197, in acquire_context
    file, cached = self._acquire_with_cache_info(needs_lock)
  File "/home/jovyan/repos/private/panel-gallery/.venv/lib/python3.10/site-packages/xarray/backends/file_manager.py", line 215, in _acquire_with_cache_info
    file = self._opener(*self._args, **kwargs)
  File "src/netCDF4/_netCDF4.pyx", line 2463, in netCDF4._netCDF4.Dataset.__init__
  File "src/netCDF4/_netCDF4.pyx", line 2026, in netCDF4._netCDF4._ensure_nc_success
OSError: [Errno -68] NetCDF: I/O failure: b'http://thredds.ucar.edu/thredds/dodsC/grib/NCEP/HRRR/CONUS_2p5km/Best'