I am making heatmap from dataframe using hvplot.heatmap. And then I have a question.
I can use hvplot.heatmap and show new heatmap. But other person want to see heatmap in excel. so I want to transform from hvplot.heatmap to excel file or dataframe. How should I do change format from hvplot.heatmap to New Dataframe.
Could someone help me?
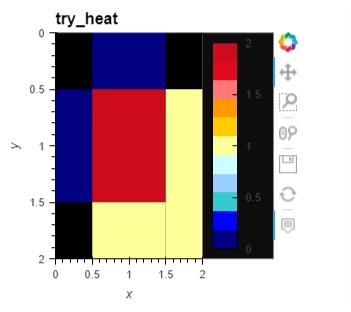
Screen shot 1 Heat Map
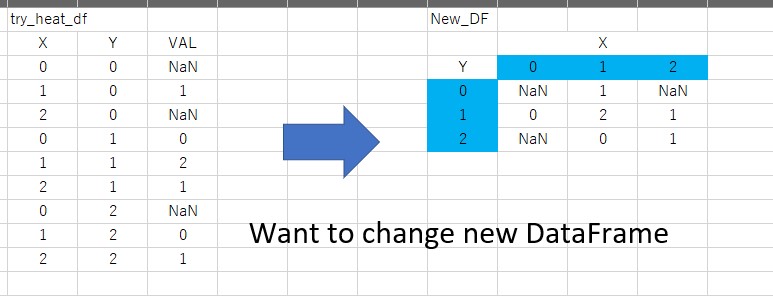
Screen shot 2 original dataframe (try_heat_df)
Screen shot 3 What I wanted to. change from heat map to New Dataframe (columns – x , index – y)
My simple code
import numpy as np
import pandas as pd
import panel as pn
import holoviews as hv
import hvplot.pandas # noqa
hv.extension('bokeh')
try_heat_df = pd.DataFrame (data = [[0,0,np.NaN],[1,0,0],[2,0,np.NaN],\
[0,1,0] ,[1,1,2], [2,1,1],\
[0,2,np.NaN],[1,2,1], [2,2,1]], \
columns = ['x','y','val'] )
plot_heat = try_heat_df.hvplot.heatmap(
x='x',
y='y',
C='val',
title=str('try_heat'),
cmap=["#000080","#0000FF","#33CCCC", "#99CCFF", "#CCFFFF", "#FFFF99", "#FFCC00", "#FF9900", "#FF7878", "#DD0b1d", "#CC0b1d"],
xaxis='bottom', width=300 , height=300 ,
).opts(
bgcolor='black',
xlim=(0,2), ylim=(2,0) , colorbar=True, clim=(0,2),clipping_colors={'NaN': 'black','-': 'black'},\
tools=['hover'],
colorbar_opts = {'background_fill_color':'black'})
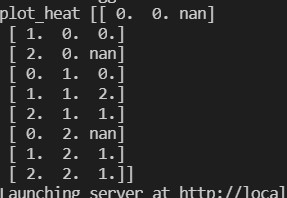
print ('plot_heat',plot_heat.data.values)
# ----------------------------------------------------------------------
# Main Function
# ----------------------------------------------------------------------
if __name__ == "__main__":
app = plot_heat
pn.serve(app)
elif __name__.startswith("bokeh"):
app = plot_heat
app.servable()