How can I render hv.option to image using hv.save

Hello , I am trying to make pdf from HoloViews.
I have met one problem. I show you this problem.

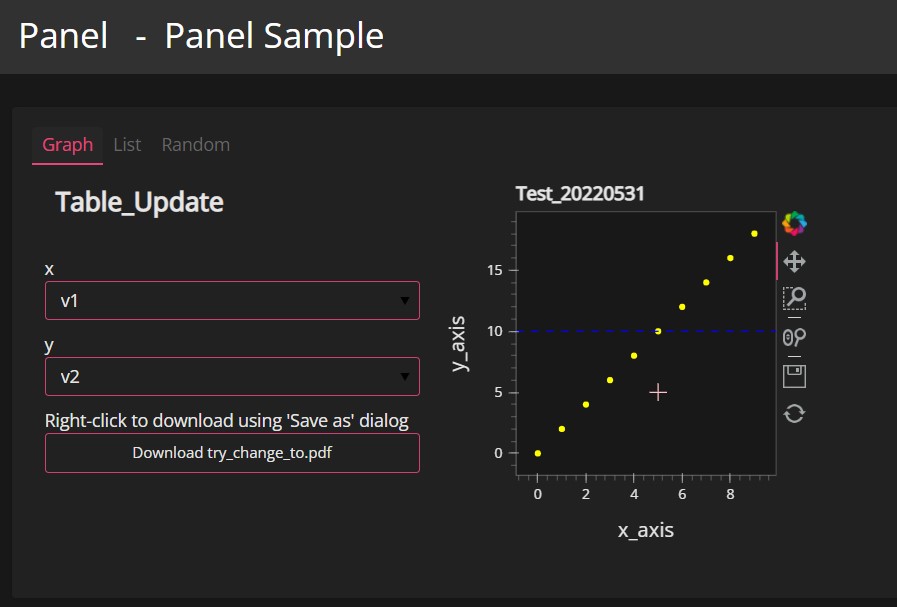
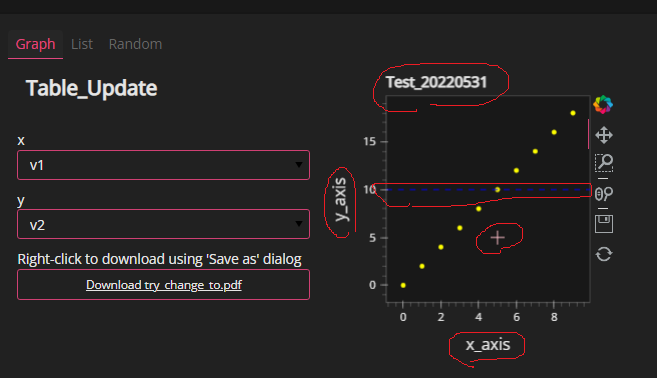
my first photo(Panel screen)

we can see title(Test20200531) & xlabel(x_axis) & ylabel(y_axis) and
hv.line color is blue and , hvPoint mark is ‘+’.
20220531_n01

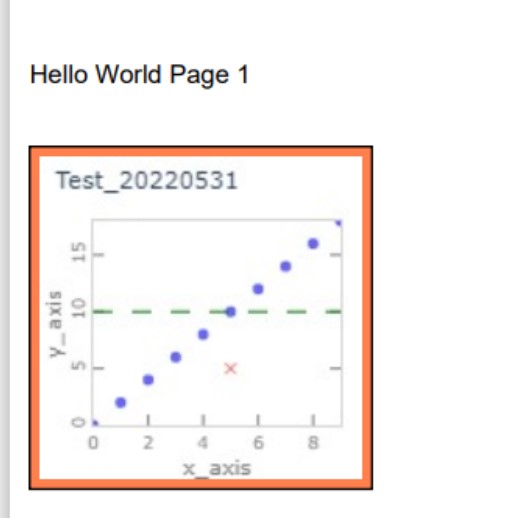
my second photo(PDF file) .

in spite of setting title and xlabel and so on , pdf file doesn’t have this parameter.

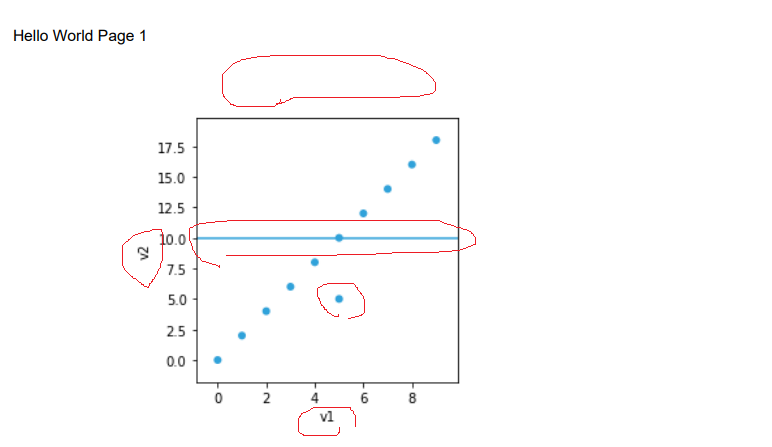
I think option setting couldn’t render to hv.save.

    p1 = hv.Scatter(source.data, x_sel.value, y_sel.value).opts(size=5, color="yellow")  # plot   
    p1.opts(size=4,title="Test_20220531", xlabel = "x_axis" , ylabel = "y_axis")
    temp_line = hv.HLine(10).opts(line_color = 'blue' , line_width=1, line_dash='dashed')
    temp_point = hv.Points([[5,5]]).opts(color='pink',marker='+',size=14)
    p1 = p1 * temp_line * temp_point
    .
    .
    hv.save(p1,file, backend='matplotlib')

Could you teach me how to render hv.option to image file?
I want to see whole parameters on png file.

This is my code

from matplotlib.pyplot import title
import pandas as pd;
import panel as pn
from bokeh.plotting import ColumnDataSource, figure
import param
from panel.template import DarkTheme,DefaultTheme
import random
pn.extension()

import holoviews as hv
from holoviews import opts
import holoviews as hv
from holoviews import dim
from holoviews.operation import histogram
from bokeh.models import HoverTool
hv.extension('bokeh')
# import hvplot.pandas

from io import BytesIO  # 20220513 add for make pdf
from reportlab.pdfgen import canvas # 20220513 add for make pdf
from reportlab.lib.pagesizes import A4, portrait # 20220513 add for make pdf
from reportlab.pdfgen import canvas

source = ColumnDataSource(
    data=dict(
        v1=list(range(0,10,1)),
        v2=list(range(0,20,2)),
        v3=list(range(0,30,3)),
        v4=list(range(0,40,4)),
    )
)

x_sel = pn.widgets.Select(value='v1', options=['v1','v2','v3','v4'], name='x')
y_sel = pn.widgets.Select(value='v2', options=['v1','v2','v3','v4'], name='y')

button_random  = pn.widgets.Button(name='random')

First_Flag = True
State_value = 0     # State --- 0 (Graph,List)
# ----------------------------------------------------------------------
#   Selcetion Table
# ----------------------------------------------------------------------
@pn.depends()
class ReactiveTable(param.Parameterized):
    table = param.DataFrame(pd.DataFrame(source.data).T)
    v1 = param.Number()     
    save_pdf_report = pn.widgets.FileDownload(button_type='success', auto=False,
                            embed=False, name="Right-click to download using 'Save as' dialog"
    )   

    def __init__(self, **params):
        super().__init__(**params)
        self.table_widget = pn.Param(self.param.table)[0]
    @param.depends('table_widget.selection')
    def update_params_with_selected_row_values(self , fst = First_Flag ):
        param_test = self.table_widget.selection
        if len(param_test) != 0 :
            if First_Flag == False :
                if  template.main[0].active == 1 :
                    self.v1 += 1
                    print ('20211118 Table list selection: ', param_test,x_sel.options[param_test[0]], 'exe ' , self.v1 , 'times')
                    x_sel.value = x_sel.options[param_test[0]]
                    change_tab(0)        
        return self.table_widget.selection  
rt = ReactiveTable()
# ----------------------------------------------------------------------
#   index search
# ----------------------------------------------------------------------
def search_index(lst, value):
    return [i for i, x in enumerate(lst) if x == value]
# ----------------------------------------------------------------------
#   Graph tab
# ----------------------------------------------------------------------
@pn.depends(x_sel,y_sel)
def autompg_plot(xval, yval, fst = First_Flag ):
    if First_Flag == False :
        if  template.main[0].active == 0 :
            rt.table_widget.selection =search_index(x_sel.options,xval)
            print ('20211118 Graph selection: ',rt.table_widget.selection)  
            # change_tab(1)  
    p1 = hv.Scatter(source.data, x_sel.value, y_sel.value).opts(size=5, color="yellow")  # plot   
    p1.opts(size=4,title="Test_20220531", xlabel = "x_axis" , ylabel = "y_axis")
    temp_line = hv.HLine(10).opts(line_color = 'blue' , line_width=1, line_dash='dashed')
    temp_point = hv.Points([[5,5]]).opts(color='pink',marker='+',size=14)
    p1 = p1 * temp_line * temp_point
    import tempfile
    import pathlib
    with tempfile.TemporaryDirectory() as tmpdir:
            #file = pathlib.Path(tmpdir) / "tmp.png"
            file = "tmp.png"                
            hv.save(p1,file, backend='matplotlib')

    output = BytesIO()
    c = canvas.Canvas(output)
    c.drawString(10, 800, "Hello World Page 1")
    # 画像ファイルの挿入
    c.drawImage(image=file, x=100 , y=500)
    c.showPage()
    c.drawString(10, 800, "Hello World Page 2")
    # 四角形の描画
    c.rect(200, 200, 100, 50)
    # 塗りつぶした四角形の描画
    c.setFillColorRGB(1.0, 0.5, 0.3)
    c.rect(300, 300, 100, 50, fill=True)
    c.save()      

    output.seek(0)

    rt.save_pdf_report.filename = 'try_change_to.pdf'
    rt.save_pdf_report.file = output
    print ('try_end')    

    return p1
# ----------------------------------------------------------------------
#   Table tab
# ----------------------------------------------------------------------
@pn.depends()
def test_list():
    ret_view = pn.Column(pn.Row(rt.param.v1),rt.table_widget, rt.update_params_with_selected_row_values)
    return ret_view

#---------------------------------------------------------------------------------------------------#
# Treat random button                                                                               #
#---------------------------------------------------------------------------------------------------#
def click_random(click): 
    rand_num = random.randint(5,10)
    r_v1=[]
    r_v2=[]
    r_v3=[]
    r_v4=[]
    for i in range(rand_num) :
        r_v1.append(random.randint(1,100))
        r_v2.append(random.randint(1,100))
        r_v3.append(random.randint(1,100))
        r_v4.append(random.randint(1,100))
    replace_df = pd.DataFrame({'v1':r_v1,'v2':r_v2,'v3':r_v3,'v4':r_v4})
    source.data.update(replace_df)  

button_random .on_click(click_random)
# ----------------------------------------------------------------------
#   main screen
# ----------------------------------------------------------------------
select_tab = 0
def main_tabs(sel_tab = select_tab):
    ret_main_tabs = pn.Tabs(
        ('Graph', pn.Row(pn.Column('## Table_Update', x_sel, y_sel,rt.save_pdf_report), autompg_plot)),
        ('List', test_list),
        ('Random',button_random),
        )
    ret_main_tabs.active = sel_tab
    return ret_main_tabs
# ----------------------------------------------------------------------
#   make template and run server
# ----------------------------------------------------------------------
template = pn.template.FastListTemplate(
    title='Panel Sample',
    site='Panel',
    main=main_tabs(select_tab),
    theme = DarkTheme ,
    theme_toggle = True , 
)
# template.servable();
# ----------------------------------------------------------------------
#   index search
# ----------------------------------------------------------------------
def change_tab(tab_number):
    template.main[0].active = tab_number
First_Flag = False
pn.serve(template)

I think it is not difficult questions. But I couldn’t find this answer.
Someone helps me?

I give up using holoviews. And I use plotly instead of it. plotly can work what I want to do.
this is a short video. Screen shows holoviews. But report is made by plotly.

In the future , holoviews can make image whole with option. I wait at this time.

this is a final my code

from turtle import position
import plotly.graph_objects as go
# plotlyを使って表示することで画像セーブ可能 (plotly can save image file)
import cv2
# resize for pdf
import numpy as np

from matplotlib.pyplot import title
import pandas as pd;
import panel as pn
from bokeh.plotting import ColumnDataSource, figure
import param
from panel.template import DarkTheme,DefaultTheme
import random
pn.extension()

import holoviews as hv
from holoviews import opts
import holoviews as hv
from holoviews import dim
from holoviews.operation import histogram
from bokeh.models import HoverTool
hv.extension('bokeh')
# import hvplot.pandas

from io import BytesIO  # 20220513 add for make pdf
from reportlab.pdfgen import canvas # 20220513 add for make pdf
from reportlab.lib.pagesizes import A4, portrait # 20220513 add for make pdf
from reportlab.pdfgen import canvas

source = ColumnDataSource(
    data=dict(
        v1=list(range(0,10,1)),
        v2=list(range(0,20,2)),
        v3=list(range(0,30,3)),
        v4=list(range(0,40,4)),
    )
)

x_sel = pn.widgets.Select(value='v1', options=['v1','v2','v3','v4'], name='x')
y_sel = pn.widgets.Select(value='v2', options=['v1','v2','v3','v4'], name='y')

button_random  = pn.widgets.Button(name='random')

First_Flag = True
State_value = 0     # State --- 0 (Graph,List)
# ----------------------------------------------------------------------
#   Selcetion Table
# ----------------------------------------------------------------------
@pn.depends()
class ReactiveTable(param.Parameterized):
    table = param.DataFrame(pd.DataFrame(source.data).T)
    v1 = param.Number()     
    save_pdf_report = pn.widgets.FileDownload(button_type='success', auto=False,
                            embed=False, name="Right-click to download using 'Save as' dialog"
    )   

    def __init__(self, **params):
        super().__init__(**params)
        self.table_widget = pn.Param(self.param.table)[0]
    @param.depends('table_widget.selection')
    def update_params_with_selected_row_values(self , fst = First_Flag ):
        param_test = self.table_widget.selection
        if len(param_test) != 0 :
            if First_Flag == False :
                if  template.main[0].active == 1 :
                    self.v1 += 1
                    print ('20211118 Table list selection: ', param_test,x_sel.options[param_test[0]], 'exe ' , self.v1 , 'times')
                    x_sel.value = x_sel.options[param_test[0]]
                    change_tab(0)        
        return self.table_widget.selection  
rt = ReactiveTable()
# ----------------------------------------------------------------------
#   index search
# ----------------------------------------------------------------------
def search_index(lst, value):
    return [i for i, x in enumerate(lst) if x == value]
# ----------------------------------------------------------------------
#   Graph tab
# ----------------------------------------------------------------------
@pn.depends(x_sel,y_sel)
def autompg_plot(xval, yval, fst = First_Flag ):
    if First_Flag == False :
        if  template.main[0].active == 0 :
            rt.table_widget.selection =search_index(x_sel.options,xval)
            print ('20211118 Graph selection: ',rt.table_widget.selection)  
            # change_tab(1)  

    # 2022/09/01 use hv.Scatter for interactive 

    p1 = hv.Scatter(source.data, x_sel.value, y_sel.value).opts(size=5, color="yellow")  # plot   
    p1.opts(size=4,title="Test_20220531", xlabel = "x_axis" , ylabel = "y_axis")
    temp_line = hv.HLine(10).opts(line_color = 'blue' , line_width=1, line_dash='dashed')
    temp_point = hv.Points([[5,5]]).opts(color='pink',marker='+',size=14)
    p1 = p1 * temp_line * temp_point

    # 2022/09/01 use plotly for save screen
    layout_t = go.Layout(
        plot_bgcolor = 'white', # グラフ内の背景色
        legend=dict(
            bgcolor ='lightblue', # bg
            bordercolor ='blue', # border
            borderwidth = 2 ,
        ),
        font_size=8 , hoverlabel_font_size = 8,
        height = 150 , width = 150 , 

    )    
    fig = go.Figure(layout=layout_t)
    fig.add_trace(go.Scatter(x=source.data[x_sel.value],y=source.data[y_sel.value],mode="markers",
        marker=go.scatter.Marker(size=5,color='blue',opacity=0.6,colorscale="Viridis")
    ))
    fig.update_xaxes(showline = True, linecolor ='lightgray', color = 'grey', ticks = 'inside', side='bottom',
                    automargin = False , mirror = 'all' ,
                    title = "x_axis",range=(min(source.data[x_sel.value]),max(source.data[x_sel.value])))
    fig.update_yaxes(showline = True, linecolor ='lightgray', color = 'grey', ticks = 'inside', side='left',
                    automargin = False , mirror = 'all' , tickangle = 270 ,
                    title = "y_axis",range=(min(source.data[y_sel.value]),max(source.data[y_sel.value])))

    fig.update_layout(title = dict(text="Test_20220531",
                                 y=0.95
                                ),
                      xaxis = dict(position=0,),
    ) 
    fig.add_hline(10,line_color = 'green' , line_width = 1, line_dash='dash')
    fig.add_trace(go.Scatter(x=[5],y=[5],mode="markers",
        marker=go.scatter.Marker(size=5,color='red',opacity=0.6,colorscale="Viridis",symbol='x-thin-open')
    ))
    fig.update_layout(margin=dict(t=30,b=25,l=25,r=10),showlegend=False)

    import tempfile
    import pathlib
    with tempfile.TemporaryDirectory() as tmpdir:
            #一度ファイルにセーブしCV2でリードしリサイズ後に再度セーブ
            file = "tmp.jpg"       
            fig.write_image(file)         
            #img = cv2.imread(file)
            #height , width = img.shape[:2]
            #imageをリサイズ
            #small_img = cv2.resize(img,(int(height*0.4),int(width*0.4)))            
            #cv2.imwrite(file, img)     

    output = BytesIO()
    c = canvas.Canvas(output)
    c.drawString(10, 800, "Hello World Page 1")
    # 画像ファイルの挿入
    c.setFillColorRGB(1.0, 0.5, 0.3)
    c.rect(10, 610, 160, 160, fill=True)
    c.drawImage(image=file, x=15 , y=615)
    c.showPage()
    c.drawString(10, 800, "Hello World Page 2")
    # 四角形の描画
    c.rect(200, 200, 100, 50)
    # 塗りつぶした四角形の描画
    c.setFillColorRGB(1.0, 0.5, 0.3)
    c.rect(300, 300, 100, 50, fill=True)
    c.save()      

    output.seek(0)

    rt.save_pdf_report.filename = 'try_change_to.pdf'
    rt.save_pdf_report.file = output
    print ('try_end')    

    return p1
# ----------------------------------------------------------------------
#   Table tab
# ----------------------------------------------------------------------
@pn.depends()
def test_list():
    ret_view = pn.Column(pn.Row(rt.param.v1),rt.table_widget, rt.update_params_with_selected_row_values)
    return ret_view

#---------------------------------------------------------------------------------------------------#
# Treat random button                                                                               #
#---------------------------------------------------------------------------------------------------#
def click_random(click): 
    rand_num = random.randint(5,10)
    r_v1=[]
    r_v2=[]
    r_v3=[]
    r_v4=[]
    for i in range(rand_num) :
        r_v1.append(random.randint(1,100))
        r_v2.append(random.randint(1,100))
        r_v3.append(random.randint(1,100))
        r_v4.append(random.randint(1,100))
    replace_df = pd.DataFrame({'v1':r_v1,'v2':r_v2,'v3':r_v3,'v4':r_v4})
    source.data.update(replace_df)  

button_random .on_click(click_random)
# ----------------------------------------------------------------------
#   main screen
# ----------------------------------------------------------------------
select_tab = 0
def main_tabs(sel_tab = select_tab):
    ret_main_tabs = pn.Tabs(
        ('Graph', pn.Row(pn.Column('## Table_Update', x_sel, y_sel,rt.save_pdf_report), autompg_plot)),
        ('List', test_list),
        ('Random',button_random),
        )
    ret_main_tabs.active = sel_tab
    return ret_main_tabs
# ----------------------------------------------------------------------
#   make template and run server
# ----------------------------------------------------------------------
template = pn.template.FastListTemplate(
    title='Panel Sample',
    site='Panel',
    main=main_tabs(select_tab),
    theme = DarkTheme ,
    theme_toggle = True , 
)
# template.servable();
# ----------------------------------------------------------------------
#   index search
# ----------------------------------------------------------------------
def change_tab(tab_number):
    template.main[0].active = tab_number
First_Flag = False
pn.serve(template)

My movie doesn’t work . So I upload picture.

First Picture Panel use holoviews

Second Picture use plotly. ( can change all option to pdf)

1 Like