I can though change the color opts each time I generate a plot via
curve_opts = opts.Curve(line_width=4, responsive=True, color=hv.Cycle(colors.COLOR_CYCLE))
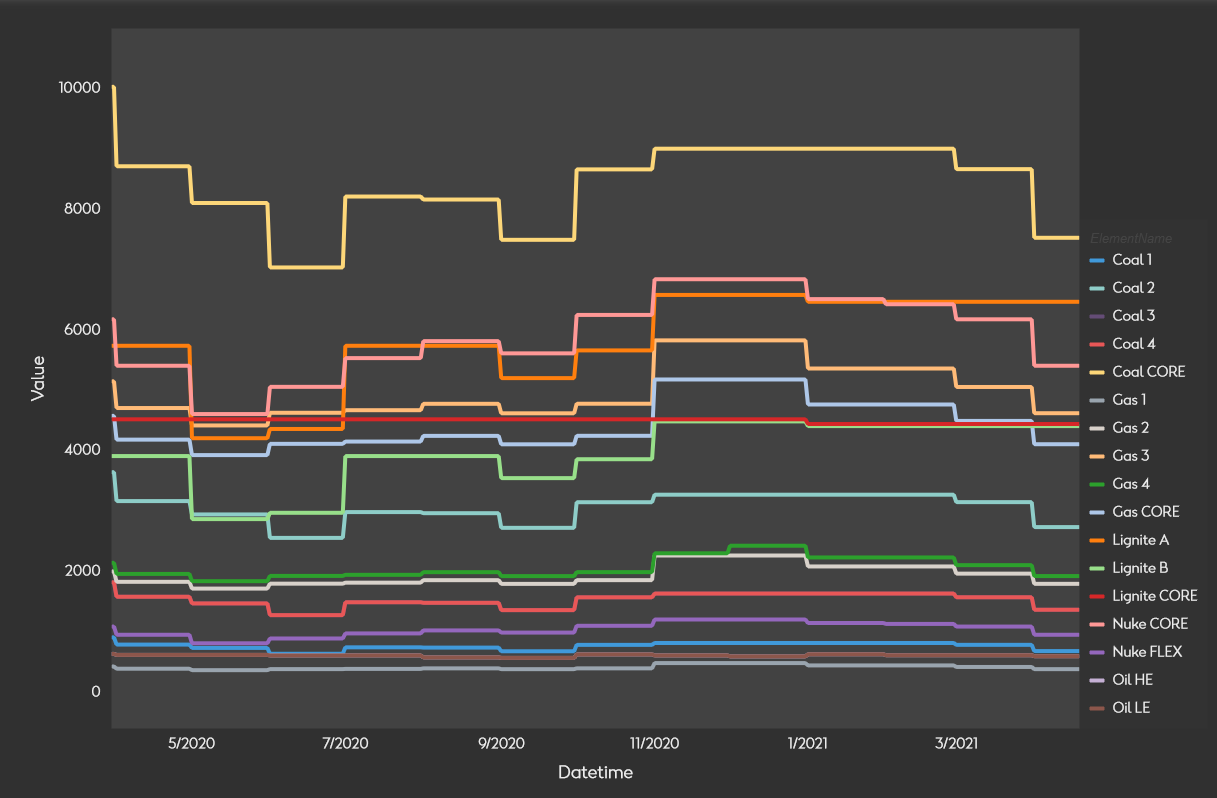
return data.hvplot(x="Datetime", y="Value", by="ElementName").opts(
curve_opts
)
But I would like to avoid that.