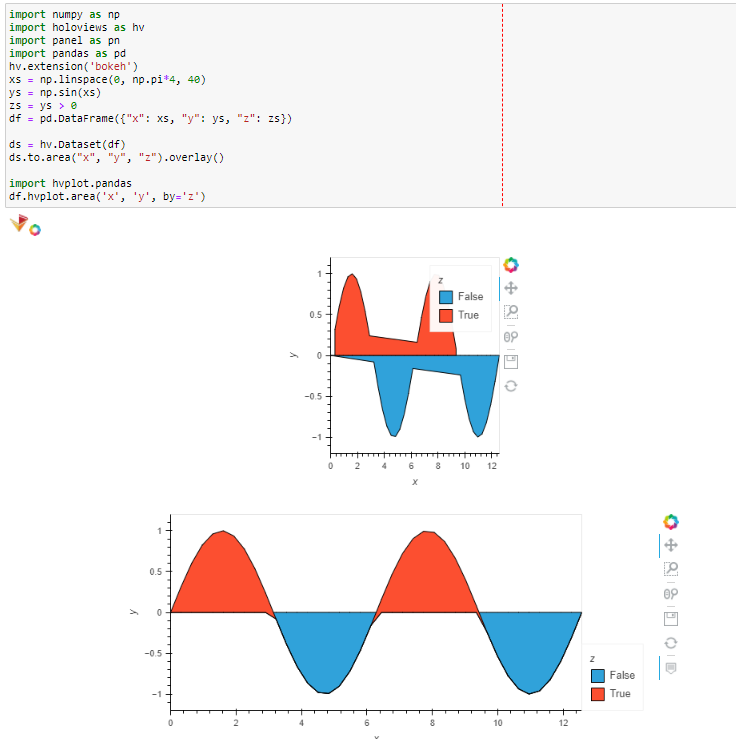
I have an area plot where I would like to use colors to make it very clear when
values are positive or negative
values are large (absolutely) or not.
How can I show positive values with green color and negative values with read color?
How can I use a colormap with the area chart to indicate large (absolute) values?
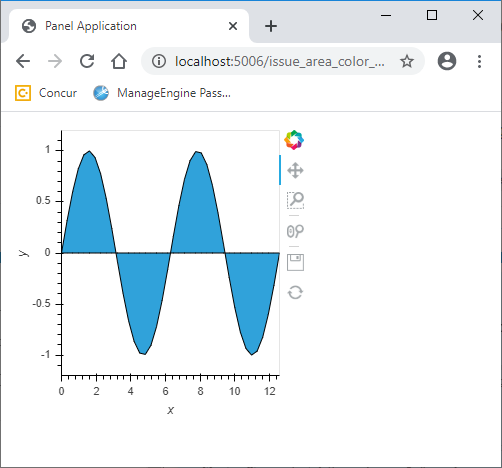
import numpy as np
import holoviews as hv
import panel as pn
hv.extension('bokeh')
xs = np.linspace(0, np.pi*4, 40)
area = hv.Area((xs, np.sin(xs)))
pn.panel(area).servable()
import numpy as np
import holoviews as hv
import panel as pn
hv.extension('bokeh')
xs = np.linspace(0, np.pi*4, 40)
area = hv.Area((xs, np.sin(xs)))

area.apply.opts(color=hv.dim('y').bin([-2, 0, 2], ["black", "red"]))
But yields:
Mapping a dimension to the “color” style option is not supported by the Area element using the bokeh backend. To map the “y” dimension to the color use a groupby operation to overlay your data along the dimension.