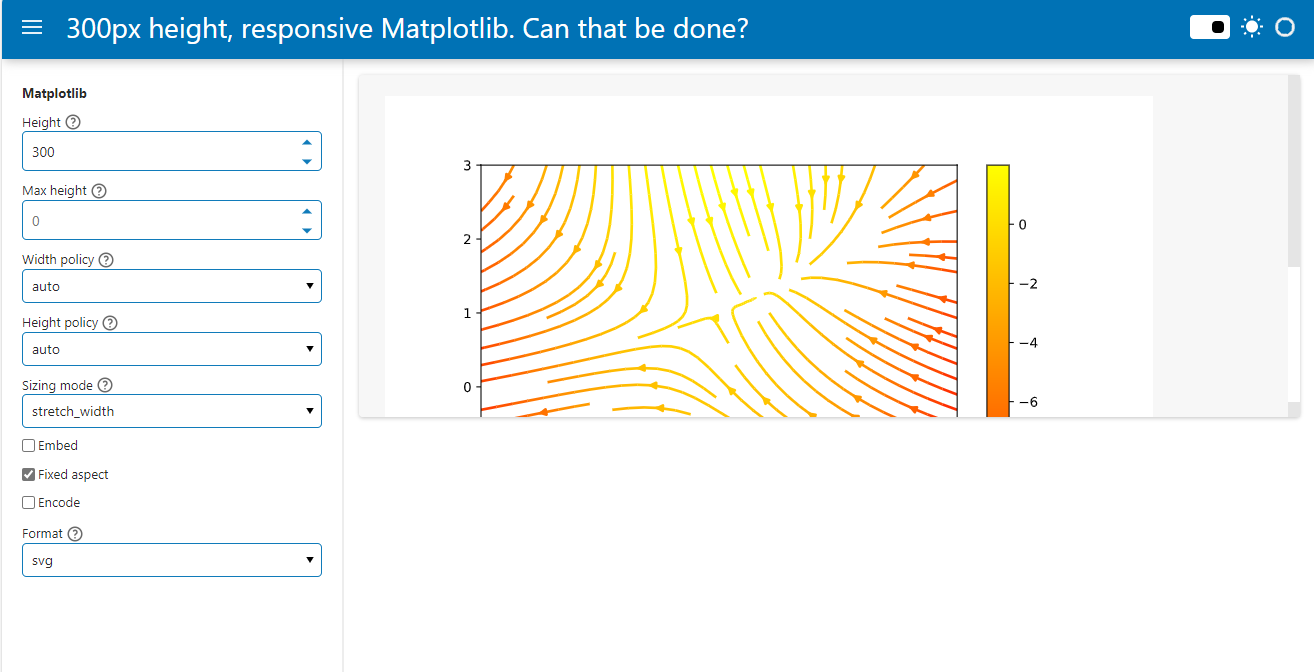
Hi. I would like to be able to make my Matplotlib plots horizontally responsive. But I cannot figure out how to do this.
There are many parameters (see sidebar below) that can be tweaked but none that achieves my goal.
import numpy as np
import panel as pn

from matplotlib import cm
from matplotlib.figure import Figure


def figure():
    Y, X = np.mgrid[-3:3:100j, -3:3:100j]
    U = -1 - X**2 + Y
    V = 1 + X - Y**2

    fig0 = Figure(figsize=(8, 6))
    ax0 = fig0.subplots()

    strm = ax0.streamplot(X, Y, U, V, color=U, linewidth=2, cmap=cm.autumn)
    fig0.colorbar(strm.lines)
    return fig0

fig = figure()

component = pn.pane.Matplotlib(
    fig,
    height=300,
    format="svg",
    encode=False,
    fixed_aspect=False,
    sizing_mode="stretch_width",
)

settings = pn.Param(component, parameters=[
    "height", "max_height", "encode", "embed", "fixed_aspect", "format", "sizing_mode", "width_policy", "height_policy"
])

pn.template.FastListTemplate(
    title="300px height, responsive Matplotlib. Can that be done?",
    main=[component],
    sidebar=[settings]
).servable()