How do I delete my selected point dynamically from other points in a mapview using holoviews Datalink

I am trying to create a dynamic widget that links a data frame and a map using Datalinks. The user can select points from either the map view or from the data frame interactively. It was all straightforward until I wanted to create a logic that will remove/delete the selected points from my dataset and update the map with what was left using a button click. Using hv.stream, I was able to get the data frame index, but I cannot retrieve that outside the callback function. Please guys, I really need help here, I am out of ideas. I am looking for a way to get the updated data frame after removing selected points from the map view or table. I hope this is possible

Here is a sample of my code;

import geopandas as gpd
import panel as pn
import pandas as pd
import numpy as np
import holoviews as hv
import geoviews as gv
import cartopy.crs as ccrs
from holoviews.plotting.links import DataLink
from geoviews import opts, tile_sources as gvts

minx=-179.148909
miny = 18.910360999999998
maxx = 179.77847
maxy = 71.365162

# set sample size
n = 100
# generate random data within the bounds
x = np.random.uniform(minx, maxx, n)
y = np.random.uniform(miny, maxy, n)

# convert them to a points GeoSeries
gdf_points = gpd.GeoSeries(gpd.points_from_xy(x, y))


# convert to geoframe and assign date to rows

day_list=pd.to_datetime(['2015-01-02','2016-05-05','2015-08-09'])

data = gpd.GeoDataFrame(pd.DataFrame (gdf_points, columns=['geometry']), crs='epsg:4326', geometry=gdf_points.geometry)
data["random_day"] = np.random.choice(day_list, size=len(data))


class MyWidget():
    
    idx = None
    
    def __init__(self,data, **params):
        super().__init__(**params)
        self.data = data
        
    def Main(self):
        button = pn.widgets.Button(name='Delete', button_type='primary')
        
        @pn.depends(button)
        def Show():
            tabs =hv.Table(self.data.drop(columns='geometry')).opts(width=400,selectable='checkbox')
            table_map = gv.Points(list(self.data.geometry), crs=ccrs.PlateCarree())
            DataLink(table_map, tabs)
            
            idx = hv.streams.Selection1D(source= table_map)
            overlay = (gvts.EsriImagery*table_map).opts(
                            opts.Points(width=500, height=550, tools=['hover', 'tap', 'box_select','lasso_select'], toolbar='right',xaxis=None,
                              yaxis=None,color='white',selection_fill_color='firebrick',alpha=1,line_color='black',size=10),
                            opts.WMTS(max_zoom=30))
            
            return pn.Column(table_map +tabs,idx)
        
        def getidx():
            if idx != None:
                return idx
        
        
        def view():
            
            return pn.Row(button,Show(),getidx)
        
        return view()
    
MyWidget(data).Main()

As shown below, I can capture the index of the selected data frame only inside the call-back function. appending the streaming event to a list did not work for me either

I have a same question like as you.

Screen shot


I want to delete two points , showing above points. And I want to reline(slope line) with using new data. Could anyone help us? I hope there is a good solution.

My simple code

from typing import Any
from bokeh.models.annotations import Title
import hvplot.pandas  # noqa
import numpy as np
import pandas as pd
import panel as pn
import param
import holoviews as hv
from numpy.random import *

INDICES = ["v1", "v2", "v3", "v4"]

#------------------------------------------------------------------------------------
# Definition ReactiveTable Class
#------------------------------------------------------------------------------------
class ReactiveTable(pn.viewable.Viewer):
    table = param.DataFrame()  # x,y table
    count = param.Integer()    # number of items
    random = param.Action(lambda x: x.param.trigger("random"), label="Random")
    x = param.ObjectSelector(INDICES[0], objects=INDICES, label="x")  # selector x
    y = param.ObjectSelector(INDICES[1], objects=INDICES, label="y")  # selector y
    Autocomplete_area = pn.widgets.AutocompleteInput(name='Autocomplete Input', options=INDICES, placeholder='Write something here')    
    table_widget = param.Parameter()  # to get table_widget.selection to work in depends
    Toggle_tf = param.Boolean() # <--- 20211220 add Toggle_tf param

    def __init__(self, **params):
        super().__init__(**params)
        self.table_widget = pn.Param(self.param.table)[0]
        self.Toggle = pn.widgets.Toggle.from_param(self.param.Toggle_tf,name='Push Toggle', button_type='default') # <<-- 20211220 add button_widget

    def change_data(self) :
        size = np.random.randint(10, 15)
        nums = np.random.randint(5, 10)                      # <--- 2021/12/06  Change nums of items 
        self.count = nums                                    # <--- 2021/12/06  Display nums of items
        INDICES = [ str('v'+str(i)) for i in range(nums) ]   # <--- 2021/12/06  Make a new indices list
        # self.table = pd.DataFrame(
        # {i: np.random.randint(1, 100, size) for i in INDICES}
        # ).T
        test = pd.DataFrame(
        {i: np.arange(1, 100, size) for i in INDICES}) # numpy.arange([start, ]stop, [step, ]dtype = None)
        test.iloc[2]['v0']=test.iloc[2]['v0']/(rand()+1)     
        test.iloc[3]['v0']=test.iloc[3]['v0']*(rand()+1)      
        self.table = test.T
        self.param.x.objects = INDICES   # change selector x lists
        self.param.y.objects = INDICES   # change selector y lists
        self.Autocomplete_area.options = INDICES

    # Definition click random button
    #@param.depends("random", watch=True, on_init=True)
    @param.depends('Toggle_tf',watch=True, on_init=True)
    def _fill_table_with_random_data(self):
        if hasattr(self, "tabs") : 
            if self.Toggle_tf == True :       
                self.change_data()
                self.Toggle.name = 'Finish'
                self.Toggle.button_type = 'primary'
            else :
                self.Toggle.name = 'Push Toggle'
                self.Toggle.button_type = 'default'
        else :
            self.change_data()

    # Definition click table widget
    @param.depends("table_widget.selection", watch=True)
    def _set_x_with_table_selection(self):
        OBJECT = (self.param.x.objects)
        if self.table_widget.selection:
            self.x = OBJECT[self.table_widget.selection[0]]
            if hasattr(self, "tabs") : self.tabs.active = 0  # if it is not initial , self has tabs objects. so change active tab=0 
        else:
            self.x = OBJECT[0]
    
        # self.count += 1 # <--- 2021/12/06 Comment out

    # Definition select x value
    @param.depends("x",watch=True)
    def _set_table_selection_with_x(self):
        OBJECT = (self.param.x.objects)
        self.table_widget.selection = [OBJECT.index(self.x)]
        self.Autocomplete_area.value = self.x

    @param.depends("Autocomplete_area.value",watch=True)
    def _set_table_selection_with_Autocomplete_area(self):
        OBJECT = (self.Autocomplete_area.options)
        sel = self.Autocomplete_area.value
        if (sel in OBJECT) : 
            self.table_widget.selection = [OBJECT.index(self.Autocomplete_area.value)]

    # Definition select x,y value or click random button
#    @param.depends("x", "y", "random")
    @param.depends("x", "y", "Toggle_tf")

    def plot(self):
        #相関係数を計算
        x_corr = self.table.T[self.x].to_numpy().tolist() 
        y_corr = self.table.T[self.y].to_numpy().tolist()
        # 相関行列を計算
        coef = np.corrcoef(x_corr, y_corr)
        # 相関行列を表示
        print('20220105 Debug correlation value : ',coef)
        a, b = np.polyfit(x_corr, y_corr, 1)  
        if b>0 :
            plot_title = 'Rxy='+str(coef[0][1])[0:4] + ' : y='+str(a)[0:5]+'x+'+str(b)[0:5] 
        else :
            plot_title = 'Rxy='+str(coef[0][1])[0:5] + ' : y='+str(a)[0:5]+'x'+str(b)[0:6]               
        graph_1 = self.table.T.hvplot.scatter(
            x=self.x, y=self.y, color="red", grid=True, xlim=(0, 100), ylim=(0, 100) 
        ).opts(title=plot_title)
        graph_2 =  hv.Slope(a, b).opts(color='green', line_width=4 , line_dash='dashed')
        plot = graph_1 * graph_2
        return plot

    # Definition update data table
    @param.depends("table")
    def table_list(self):
        return pn.pane.DataFrame(self.table, sizing_mode="fixed")

    # Definition panel layout
    def __panel__(self):
        # Layout
        graph_layout = pn.Row(
            pn.Column(
                pn.pane.Markdown("## Update table"),
                self.param.x,
                self.Autocomplete_area,
                self.param.y,
                # self.param.random,
                self.Toggle,
            ),
            pn.panel(self.plot, sizing_mode="fixed"),
        )
        list_layout = pn.Column(self.table_widget, self.param.count, self.param.random)

        self.tabs = pn.Tabs(
            ("Graph", graph_layout),
            ("List", list_layout),
            active=self.tabs.active if hasattr(self, "tabs") else 0,
        )

        return pn.template.FastListTemplate(
            site="Panel",
            main=self.tabs,
            title="Panel Sample",
            theme="dark",
        )

# run app
if __name__ == "__main__":
    app = ReactiveTable()
    app.show(port=5007)
elif __name__.startswith("bokeh"):
    app = ReactiveTable()
    app.servable()

Something like this maybe

import holoviews as hv
import panel as pn
import pandas as pd

pn.extension()
hv.extension("bokeh")

df = pd.DataFrame({"x": [0, 1, 2], "y": [3, 4, 5]})
memory = set([])

def plot(index):
    print(i)
    for i in index:
        memory.add(i)  # add previous indices
    df2 = df.loc[~df.index.isin(memory)]  # remove all past indices
    print(memory, df2)  # debug
    return hv.Scatter(df2, "x", "y").opts(size=25, tools=["tap"])  # plot

tap = hv.streams.Selection1D()
scatter = hv.DynamicMap(plot, streams=[tap])  # react if tap changes
tap.source = scatter  # set where tap gets its data points from

scatter
2 Likes

@ahuang11 Thank your for your quick answer. It works that I wanted. I will try my program and inform my result.

2 Likes

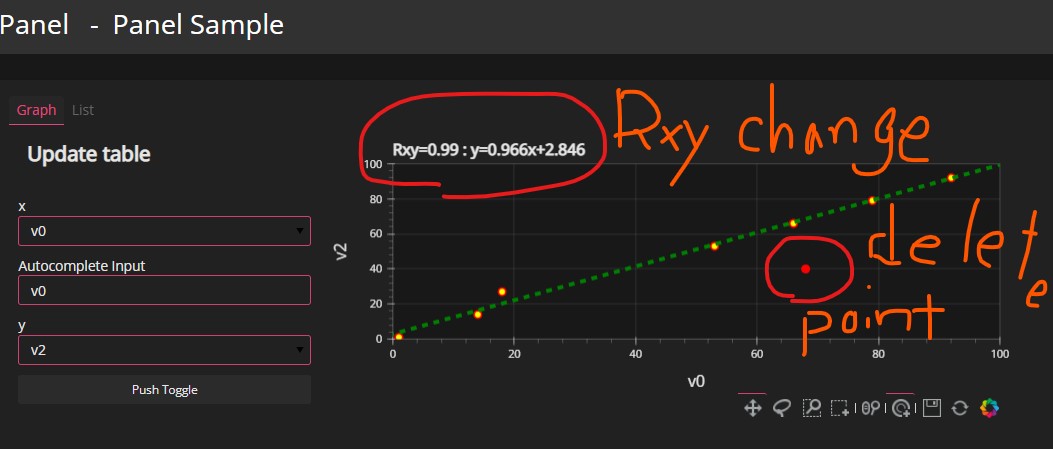
@ahuang11 I’m sorry for late response. I tried your solution insert my code. And It works well. I delete point , change Rxy value. that’s why your solution works well.

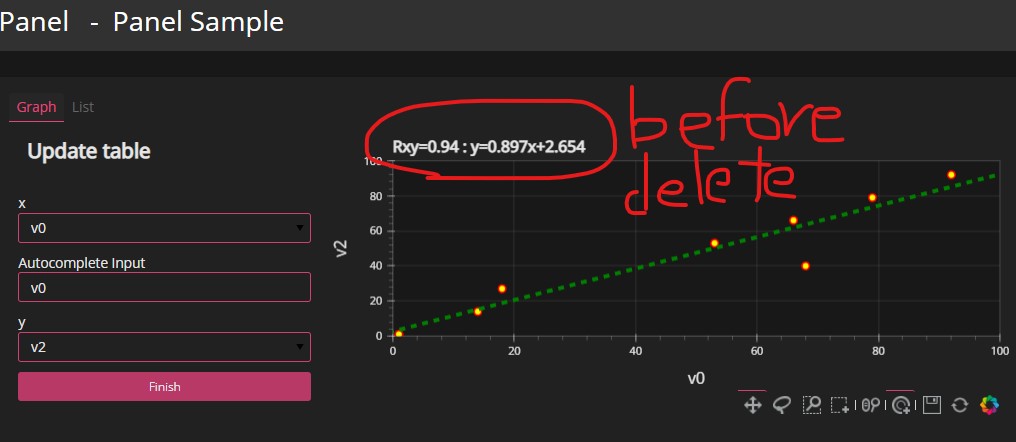
Screen shot [ Before delete ]

Screen shot [ After delete : Rxy value is changed by calculation ]

My final code

from typing import Any
from bokeh.models.annotations import Title
import hvplot.pandas  # noqa
import numpy as np
import pandas as pd
import panel as pn
import param
import holoviews as hv
from numpy.random import *

INDICES = ["v1", "v2", "v3", "v4"]
memory = set([])
#------------------------------------------------------------------------------------
# Definition ReactiveTable Class
#------------------------------------------------------------------------------------
class ReactiveTable(pn.viewable.Viewer):
    table = param.DataFrame()  # x,y table
    count = param.Integer()    # number of items
    random = param.Action(lambda x: x.param.trigger("random"), label="Random")
    x = param.ObjectSelector(INDICES[0], objects=INDICES, label="x")  # selector x
    y = param.ObjectSelector(INDICES[1], objects=INDICES, label="y")  # selector y
    int_list                = param.ListSelector(default=[3, 5], objects=[1, 3, 5, 7, 9], precedence=0.5)    
    Autocomplete_area = pn.widgets.AutocompleteInput(name='Autocomplete Input', options=INDICES, placeholder='Write something here')    
    table_widget = param.Parameter()  # to get table_widget.selection to work in depends
    Toggle_tf = param.Boolean() # <--- 20211220 add Toggle_tf param
    from holoviews import opts
    from holoviews import streams   
    selection = streams.Selection1D()   
    memory = set([])    
    first_flag = False ## Tap First Flag   

    def __init__(self, **params):
        super().__init__(**params)
        self.table_widget = pn.Param(self.param.table)[0]
        self.Toggle = pn.widgets.Toggle.from_param(self.param.Toggle_tf,name='Push Toggle', button_type='default') # <<-- 20211220 add button_widget  

    def change_data(self) :
        size = np.random.randint(10, 15)
        nums = np.random.randint(5, 10)                      # <--- 2021/12/06  Change nums of items 
        self.count = nums                                    # <--- 2021/12/06  Display nums of items
        INDICES = [ str('v'+str(i)) for i in range(nums) ]   # <--- 2021/12/06  Make a new indices list
        # self.table = pd.DataFrame(
        # {i: np.random.randint(1, 100, size) for i in INDICES}
        # ).T
        test = pd.DataFrame(
        {i: np.arange(1, 100, size) for i in INDICES}) # numpy.arange([start, ]stop, [step, ]dtype = None)
        test.iloc[2]['v0']=test.iloc[2]['v0']/(rand()+1)     
        test.iloc[3]['v0']=test.iloc[3]['v0']*(rand()+1)      
        self.table = test.T
        self.param.x.objects = INDICES   # change selector x lists
        self.param.y.objects = INDICES   # change selector y lists
        self.Autocomplete_area.options = INDICES

    # Definition click random button
    #@param.depends("random", watch=True, on_init=True)
    @param.depends('Toggle_tf',watch=True, on_init=True)
    def _fill_table_with_random_data(self):
        if hasattr(self, "tabs") : 
            self.memory=[]
            self.first_flag = True                 
            if self.Toggle_tf == True :       
                self.change_data()
                self.Toggle.name = 'Finish'
                self.Toggle.button_type = 'primary'           
            else :
                self.Toggle.name = 'Push Toggle'
                self.Toggle.button_type = 'default'
                 
        else :
            self.change_data()

    # Definition click table widget
    @param.depends("table_widget.selection", watch=True)
    def _set_x_with_table_selection(self):
        OBJECT = (self.param.x.objects)
        if self.table_widget.selection:
            self.x = OBJECT[self.table_widget.selection[0]]           
            if hasattr(self, "tabs") : self.tabs.active = 0  # if it is not initial , self has tabs objects. so change active tab=0 
        else:
            self.x = OBJECT[0]
           
    
        # self.count += 1 # <--- 2021/12/06 Comment out

    # Definition select x value
    @param.depends("x",watch=True)
    def _set_table_selection_with_x(self):
        OBJECT = (self.param.x.objects)
        self.table_widget.selection = [OBJECT.index(self.x)]
        self.Autocomplete_area.value = self.x
        self.memory=[]  
        self.first_flag = True            

    @param.depends("Autocomplete_area.value",watch=True)
    def _set_table_selection_with_Autocomplete_area(self):
        OBJECT = (self.Autocomplete_area.options)
        sel = self.Autocomplete_area.value
        if (sel in OBJECT) : 
            self.table_widget.selection = [OBJECT.index(self.Autocomplete_area.value)]
            self.memory=[]
            self.first_flag = True              

    # Definition select x,y value or click random button
#    @param.depends("x", "y", "random")
    @param.depends("x", "y", "selection.index" , 'Toggle_tf')

    def plot(self):        
        index = self.selection.index
        if self.first_flag == True or self.Toggle_tf == True :
            index = []
            self.first_flag = False
        print ('debug', index)
        df = pd.DataFrame ({"x": self.table.loc[self.x], "y": self.table.loc[self.y]})
        for i in index:
            self.memory.append(i)  # add previous indices
        df2 = df.loc[~df.index.isin(self.memory)]  # remove all past indices  
        new_graph = hv.Scatter(df2, "x", "y").opts(size=5, color="yellow")  # plot              
        #相関係数を計算
        x_corr = df2['x'].to_numpy().tolist() 
        y_corr = df2['y'].to_numpy().tolist()
        # 相関行列を計算
        coef = np.corrcoef(x_corr, y_corr)
        # 相関行列を表示
        print('20220105 Debug correlation value : ',coef)
        a, b = np.polyfit(x_corr, y_corr, 1)  
        if b>0 :
            plot_title = 'Rxy='+str(coef[0][1])[0:4] + ' : y='+str(a)[0:5]+'x+'+str(b)[0:5] 
        else :
            plot_title = 'Rxy='+str(coef[0][1])[0:5] + ' : y='+str(a)[0:5]+'x'+str(b)[0:6]               
        graph_1 = self.table.T.hvplot.scatter(
            x=self.x, y=self.y, color="red", grid=True, xlim=(0, 100), ylim=(0, 100) 
        ).opts(toolbar='below',size=8, title=plot_title, tools=['tap','box_select', 'lasso_select'])
        graph_2 =  hv.Slope(a, b).opts(color='green', line_width=4 , line_dash='dashed')
        # Declare points as source of selection stream   
        self.selection.source=graph_1        

        plot = graph_1 * graph_2 * new_graph
        return plot

    # Definition update data table
    @param.depends("table")
    def table_list(self):
        return pn.pane.DataFrame(self.table, sizing_mode="fixed")

    # https://holoviews.org/reference/apps/bokeh/selection_stream.html
    # https://holoviews.org/reference/containers/bokeh/DynamicMap.html

    # Definition panel layout
    def __panel__(self):
        # Layout
        graph_layout = pn.Row(
            pn.Column(
                pn.pane.Markdown("## Update table"),
                self.param.x,
                self.Autocomplete_area,
                self.param.y,
                # self.param.random,
                self.Toggle,
            ),
            pn.panel(pn.Row(self.plot), sizing_mode="fixed"),
        )
        list_layout = pn.Column(self.table_widget, self.param.count, self.param.random)

        self.tabs = pn.Tabs(
            ("Graph", graph_layout),
            ("List", list_layout),
            active=self.tabs.active if hasattr(self, "tabs") else 0,
        )

        return pn.template.FastListTemplate(
            site="Panel",
            main=self.tabs,
            title="Panel Sample",
            theme="dark",
        )

# run app
if __name__ == "__main__":
    app = ReactiveTable()
    app.show(port=5007)
elif __name__.startswith("bokeh"):
    app = ReactiveTable()
    app.servable()

Thanks for your kindness

2 Likes

Happy to have helped!

2 Likes

Hi, @ahuang11 can you implement your solution using my example from above

Have you tried my provided example? If so, do you have questions about it?

@ahuang11 sorry for some reason I missed your comment. I just revisited this page and saw that you replied me. I actually did try it but did not get it to work. Pls do you mind guiding me using my example. I will be most grateful