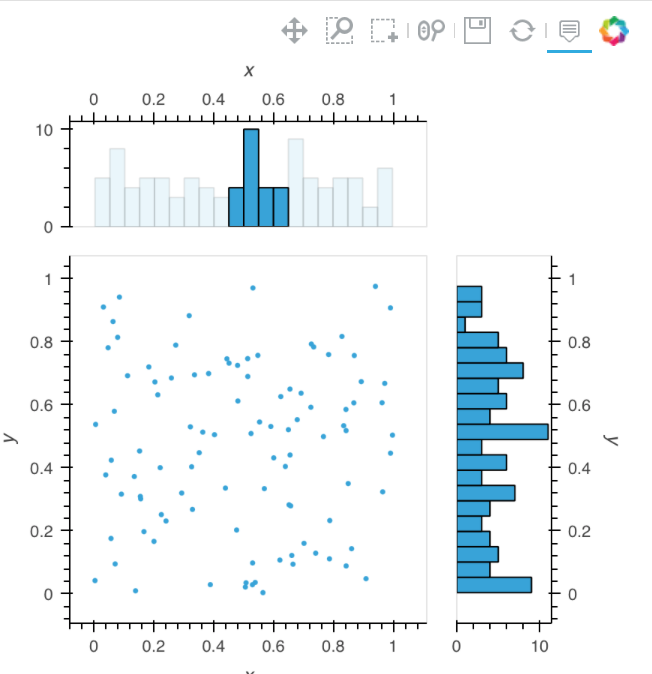
I was finally able to put together an example that does everything I needed:
- lowlighting of unselected data
- dynamic brushing works regardless of which of the three plots was selected.
In order to get the lowlighting working, I ended up drawing each plot twice. Once with all the points drawn in lowlight color, and then an overlay with the just points selected drawn in normal color. I’m sure there must be a better way to do this, and I’d appreciate any advice. I’m really looking forward to when the team is able to fix bug 5066.
import numpy as np
import pandas as pd
import holoviews as hv
from holoviews import dim
from holoviews import opts
from holoviews import streams
hv.extension('bokeh')

default_blue = '#30a2d9'
opts.defaults(opts.Points(color=default_blue, tools=['box_select'], active_tools=['box_select']),
              opts.Histogram(color=default_blue, tools=['box_select'], active_tools=['box_select'])
             )

# Declare some points
df = pd.DataFrame(data=np.random.randn(1000,2 ), columns=['x', 'y'])
points = hv.Points(df).opts(opts.Points(alpha=0.2))

# Declare points as source of selection stream
selection = streams.Selection1D(source=points)
reset = streams.PlotReset()

xhist_all = hv.operation.histogram(points, bin_range=points.range('x'), dimension='x', dynamic=True, normed=False).opts(
    opts.Histogram(alpha=0.2, width=300, height=100))
x_hist_selection = streams.BoundsX(source=xhist_all, boundsx=(0,0))

yhist_all = hv.operation.histogram(points, bin_range=points.range('y'), dimension='y', dynamic=True, normed=False).opts(
    opts.Histogram(alpha=0.2, width=100, height=300))
# y_hist_selection = streams.BoundsX(source=yhist_all, boundsx=(0,0), rename={'boundsx': 'boundsy'})  # if not rotated
y_hist_selection = streams.BoundsY(source=yhist_all, boundsy=(0,0))

def select_points(index, boundsx, boundsy, resetting):
    selected = points.iloc[:]
    if boundsx and (boundsx[0] or boundsx[1]):
        selected = points.select(selection_expr=(dim('x') >= boundsx[0])&(dim('x') <= boundsx[1]))
    if boundsy and (boundsy[0] or boundsy[1]):
        selected = points.select(selection_expr=(dim('y') >= boundsy[0])&(dim('y') <= boundsy[1]))
    if index:
        selected = points.iloc[index]
    if resetting:
        selected = points.iloc[:]
        x_hist_selection.reset()
        y_hist_selection.reset()
    return selected

# Declare DynamicMap to apply bounds selection
dmap = hv.DynamicMap(select_points, streams=[selection, x_hist_selection, y_hist_selection, reset])
xhist = hv.operation.histogram(dmap, bin_range=points.range('x'), dimension='x', dynamic=True, normed=False)
yhist = hv.operation.histogram(dmap, bin_range=points.range('y'), dimension='y', dynamic=True, normed=False)

points_plot = dmap.apply(hv.Points)

# Combine points and histograms
(points * points_plot) << (yhist_all * yhist) << (xhist_all * xhist)