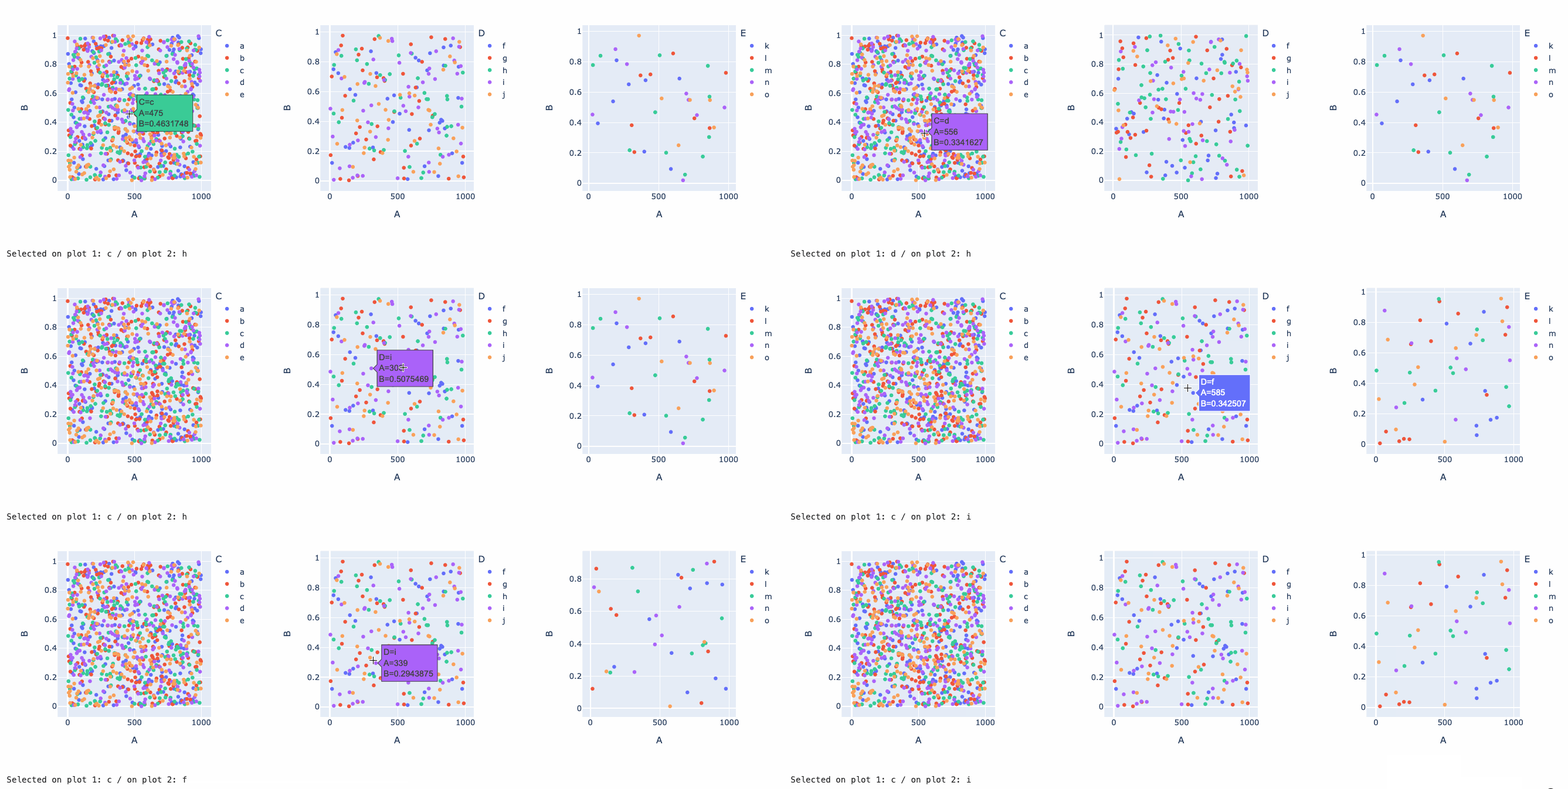
I have a use case where I want to display 3 plots.
First plot is a global view that shows categories. Second plot is a local view that shows each data point within the first plot selection. Third plot is a local view of that data point selected in the second plot.
I was using Plotly’s click_data param to make the second plot react to selection in the first plot:
plot_panel = pn.pane.Plotly(
    xpl.plot.features_importance(),
    config={"responsive": True}
)

@pn.depends(plot_panel.param.click_data)
def contribution_plot(click_data):
    if click_data:
        contribution_pane =  pn.pane.Plotly(
            xpl.plot.contribution_plot(click_data['points'][0]['label']),
            config={"responsive": True}
        )
    else:
        contribution_pane = pn.pane.Plotly(
            xpl.plot.contribution_plot(xpl.features_imp.idxmax()),
            config={"responsive": True}
        )
    return contribution_pane

material.main.append(
    pn.Row(
        pn.Column(
            header
        ),
        pn.Column(
            pn.Tabs(
                ('Smart Explainer',
                    pn.Column(
                        plot_panel,
                        contribution_plot
                    )
                )
            )
        )
    )
)
But, I’m struggling to do the same for the third plot, where the click_data depends on contribution_pane.param.click_data, since contribution_pane is defined during the function call.
Any suggestions please?
FYI: this is the same functionality that https://shapash-demo2.ossbymaif.fr/ does. I’m just experimenting with panel to display the same features.
