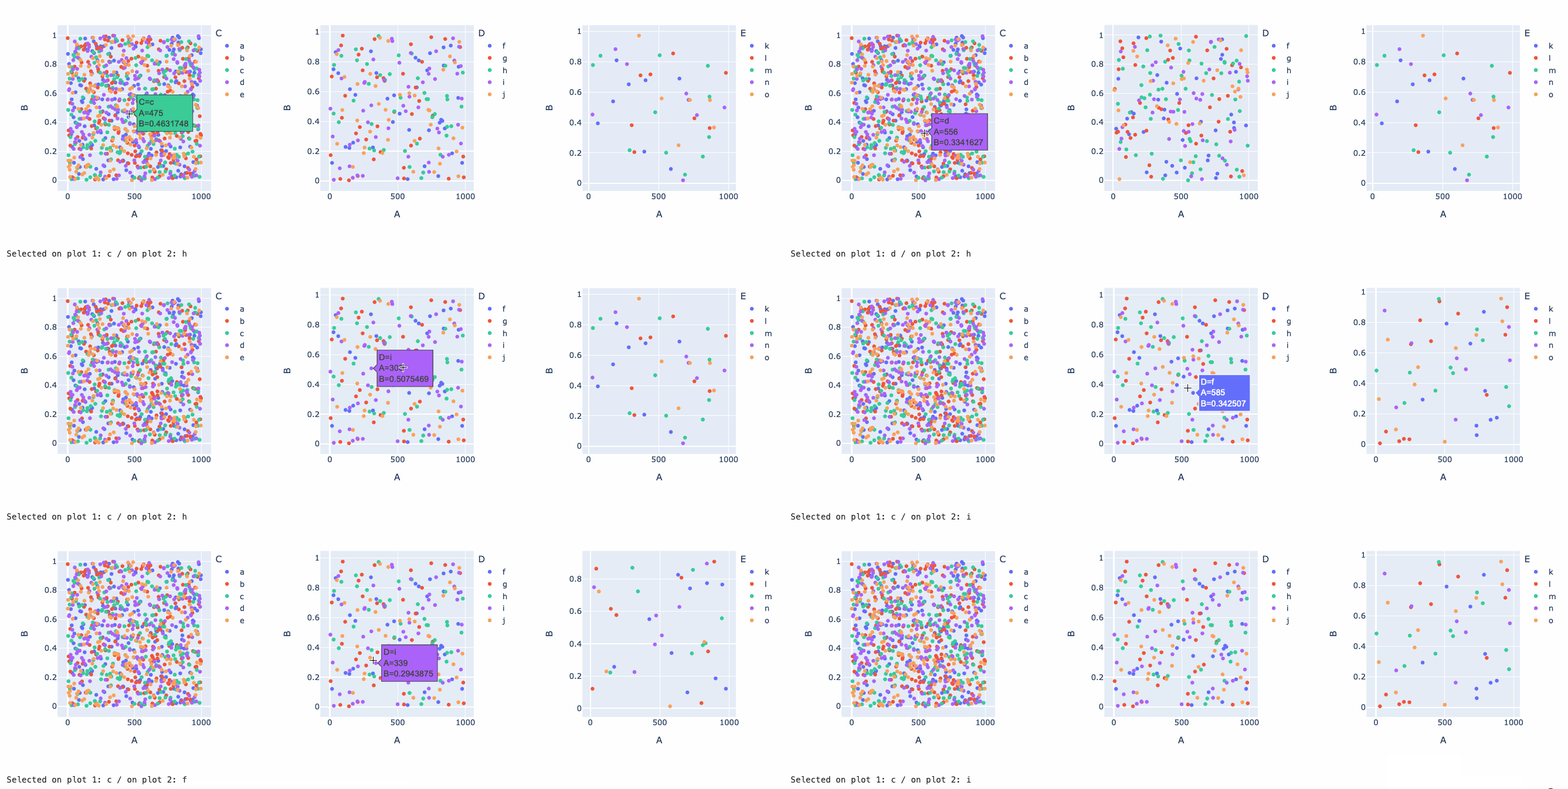
You could try something like that. A good part of the code is setting up the data, you can ignore that part and adapt it to your data structure. The approach I’ve used is to first create Plotly panes (I’ve initialized them, but they could just be empty) and add callbacks decorated with @pn.depends(plotly_pane.param.click_data, watch=True) that update the .object attribute of each pane, on a click_data event. I’ve also created a very simple state object, selected, to keep track of what is selected on each plot. I could also have used global variables, but ultimately if I’d have to keep more track of the state of the app I’d just wrap the whole thing is one or multiple classes. Hope this helps!
import numpy as np
import pandas as pd
import panel as pn
import plotly.express as px

pn.extension('plotly')

cats_c = list('abcde')
cats_d = list('fghij')
cats_e = list('klmno')
nb = 1000

df = pd.DataFrame({
    'A': np.arange(nb),
    'B': np.random.rand(nb),
    'C': np.random.choice(cats_c, nb),
    'D': np.random.choice(cats_d, nb),
    'E': np.random.choice(cats_e, nb)
})
df = df.sort_values(['C', 'D', 'E'])

def create_fig(df, color, query=None):
    if query:
        df = df.query(query)
    return px.scatter(df, x="A", y="B", color=color)

plot_panel1 = pn.pane.Plotly(create_fig(df, 'C'), width=400, height=400)
plot_panel2 = pn.pane.Plotly(create_fig(df, 'D', f'C == "{cats_c[0]}"'), width=400, height=400)
plot_panel3 = pn.pane.Plotly(create_fig(df, 'E', f'C == "{cats_c[0]}" and D == "{cats_d[0]}"'), width=400, height=400)

class selected:
    on1 = cats_c[0]
    on2 = cats_d[0]

@pn.depends(plot_panel1.param.click_data, plot_panel2.param.click_data)
def string_hello_world(*args):
    return pn.pane.Str(f'Selected on plot 1: {selected.on1} / on plot 2: {selected.on2}')

@pn.depends(plot_panel1.param.click_data, watch=True)
def _update_after_click_on_1(click_data):
    # e.g. {‘points’: [{‘curveNumber’: 3, ‘pointNumber’: 5, ‘pointIndex’: 5, ‘x’: 74, ‘y’: 0.6295433958355939}]}
    curve_index = click_data['points'][0]['curveNumber']
    selected.on1 = cats_c[curve_index]
    plot_panel2.object = create_fig(df, 'D', f'C == "{selected.on1}"')

@pn.depends(plot_panel2.param.click_data, watch=True)
def _update_after_click_on_2(click_data):
    # e.g. {‘points’: [{‘curveNumber’: 3, ‘pointNumber’: 5, ‘pointIndex’: 5, ‘x’: 74, ‘y’: 0.6295433958355939}]}
    curve_index = click_data['points'][0]['curveNumber']
    selected.on2 = cats_d[curve_index]
    plot_panel3.object = create_fig(df, 'E', f'C == "{selected.on1}" and D == "{selected.on2}"')

pn.Column(
    pn.Row(plot_panel1, plot_panel2, plot_panel3),
    string_hello_world,
)
