How do I make y-axes independent

Hi

I would like to compose two plots with dependent x-axes and independent y-axes. But I seem not to be able to do this. I’ve tried setting ylabels, use .opts and .redim but I cannot seem to get it working.

How do I achieve this?

from io import StringIO
import panel as pn
import hvplot.pandas
import pandas as pd

pn.extension(sizing_mode="stretch_width")

DEMAND_COLUMNS = ['production', 'wind']
PRICE_COLUMNS = ['Forecast Block 0', 'Forecast Block 4', 'Forecast Block 8',
       'Forecast Block 12', 'Forecast Block 16', 'Forecast Block 20', 'Actual Block 0',
       'Actual Block 4', 'Actual Block 8', 'Actual Block 12', 'Actual Block 16',
       'Actual Block 20']

CSV = """
date,production,wind,Forecast Block 0,Forecast Block 4,Forecast Block 8,Forecast Block 12,Forecast Block 16,Forecast Block 20,Actual Block 0,Actual Block 4,Actual Block 8,Actual Block 12,Actual Block 16,Actual Block 20
2022-02-27,58354.58,5918.93,185.58,171.16,157.7,125.72,214.57,230.87,180.78,182.3,189.08,150.76,240.41,236.0
2022-02-28,64862.58,2771.1,204.76,224.87,241.76,199.55,251.84,268.69,201.45,255.47,266.76,221.21,287.46,273.36
2022-03-01,65283.92,2577.23,247.84,255.2,278.58,243.09,311.95,288.11,245.22,254.84,272.76,235.89,328.98,282.4
2022-03-02,64599.62,1768.7,240.03,254.99,297.25,254.34,324.72,290.91,243.67,269.87,288.69,239.51,325.7,276.67
2022-03-03,61876.21,1444.51,263.38,286.22,317.87,265.65,371.12,308.21,319.18,353.84,354.75,316.26,387.53,348.44
2022-03-04,61812.71,2491.8,360.17,412.26,455.65,364.89,496.52,406.76,332.78,368.17,380.06,325.47,389.18,386.55
2022-03-05,58625.08,2169.33,293.79,288.98,325.53,279.24,361.89,347.97,354.12,358.25,356.61,298.77,385.18,377.32
2022-03-06,57200.0,4146.99,367.01,328.62,327.23,267.03,415.7,422.53,355.74,349.38,360.17,307.54,395.7,418.01
2022-03-07,65266.33,5801.9,381.22,440.88,471.44,356.82,509.41,454.59,368.88,434.27,466.3,364.88,461.85,430.1
2022-03-08,64519.62,5623.73,375.55,408.48,440.14,339.42,461.26,421.71,443.71,537.99,595.27,449.2,623.08,594.69
2022-03-09,62399.29,4361.3,403.28,461.18,487.04,355.21,517.44,486.79,440.88,490.81,474.26,369.64,533.61,464.59
2022-03-10,61786.96,4866.12,404.8,450.05,463.74,347.26,457.02,402.83,331.14,373.95,408.15,337.06,391.5,361.56
2022-03-11,59122.0,10027.91,264.76,270.86,292.65,197.87,277.89,268.57,236.64,226.81,298.72,273.39,308.88,327.48
2022-03-12,54070.38,7326.24,239.86,234.1,276.68,251.79,292.16,259.31,272.83,251.75,281.25,224.42,276.49,276.99
2022-03-13,52054.83,8066.67,210.2,180.07,190.92,135.17,269.57,305.08,205.56,200.8,225.14,243.8,284.4,342.22
2022-03-14,58380.0,4546.08,269.38,308.3,337.24,285.94,371.9,358.64,257.14,284.79,325.97,260.12,366.94,312.64
2022-03-15,56406.79,3537.89,298.9,328.61,374.67,320.45,404.6,359.18,243.95,289.07,315.94,281.23,348.16,296.29
2022-03-16,55086.96,3887.02,274.84,294.77,318.14,274.91,332.07,297.43,248.08,275.72,287.98,272.3,303.96,281.94
2022-03-17,57081.08,6355.05,219.66,257.65,304.92,261.0,312.86,285.97,236.95,233.5,283.22,252.62,296.02,259.27
2022-03-18,57270.83,8754.2,224.7,243.19,257.24,208.06,247.77,237.12,207.1,245.36,252.18,211.43,256.98,229.9
"""

data = pd.read_csv(StringIO(CSV), parse_dates=["date"])

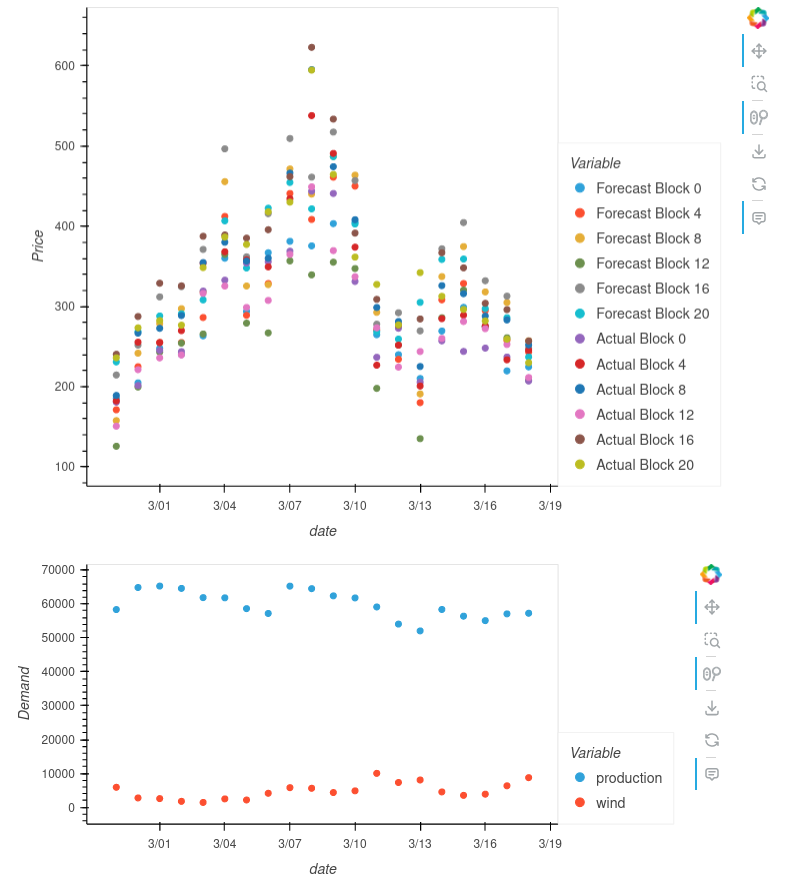
price_plot = data.hvplot(x="date", y=PRICE_COLUMNS, kind="scatter", height=500)
production_plot = data.hvplot(x="date", y=DEMAND_COLUMNS, kind="scatter", height=300)

pn.Column(
    price_plot, production_plot
).servable()

independent-y-axis

I managed to get something working using holoviews and an Overlay instead of hvplot. Would still like to know how to do this easier using hvplot.

from io import StringIO
import panel as pn
import hvplot.pandas
import pandas as pd

pn.extension(sizing_mode="stretch_width")
import holoviews as hv

DEMAND_COLUMNS = ['production', 'wind']
PRICE_COLUMNS = ['Forecast Block 0', 'Forecast Block 4', 'Forecast Block 8',
       'Forecast Block 12', 'Forecast Block 16', 'Forecast Block 20', 'Actual Block 0',
       'Actual Block 4', 'Actual Block 8', 'Actual Block 12', 'Actual Block 16',
       'Actual Block 20']

CSV = """
date,production,wind,Forecast Block 0,Forecast Block 4,Forecast Block 8,Forecast Block 12,Forecast Block 16,Forecast Block 20,Actual Block 0,Actual Block 4,Actual Block 8,Actual Block 12,Actual Block 16,Actual Block 20
2022-02-27,58354.58,5918.93,185.58,171.16,157.7,125.72,214.57,230.87,180.78,182.3,189.08,150.76,240.41,236.0
2022-02-28,64862.58,2771.1,204.76,224.87,241.76,199.55,251.84,268.69,201.45,255.47,266.76,221.21,287.46,273.36
2022-03-01,65283.92,2577.23,247.84,255.2,278.58,243.09,311.95,288.11,245.22,254.84,272.76,235.89,328.98,282.4
2022-03-02,64599.62,1768.7,240.03,254.99,297.25,254.34,324.72,290.91,243.67,269.87,288.69,239.51,325.7,276.67
2022-03-03,61876.21,1444.51,263.38,286.22,317.87,265.65,371.12,308.21,319.18,353.84,354.75,316.26,387.53,348.44
2022-03-04,61812.71,2491.8,360.17,412.26,455.65,364.89,496.52,406.76,332.78,368.17,380.06,325.47,389.18,386.55
2022-03-05,58625.08,2169.33,293.79,288.98,325.53,279.24,361.89,347.97,354.12,358.25,356.61,298.77,385.18,377.32
2022-03-06,57200.0,4146.99,367.01,328.62,327.23,267.03,415.7,422.53,355.74,349.38,360.17,307.54,395.7,418.01
2022-03-07,65266.33,5801.9,381.22,440.88,471.44,356.82,509.41,454.59,368.88,434.27,466.3,364.88,461.85,430.1
2022-03-08,64519.62,5623.73,375.55,408.48,440.14,339.42,461.26,421.71,443.71,537.99,595.27,449.2,623.08,594.69
2022-03-09,62399.29,4361.3,403.28,461.18,487.04,355.21,517.44,486.79,440.88,490.81,474.26,369.64,533.61,464.59
2022-03-10,61786.96,4866.12,404.8,450.05,463.74,347.26,457.02,402.83,331.14,373.95,408.15,337.06,391.5,361.56
2022-03-11,59122.0,10027.91,264.76,270.86,292.65,197.87,277.89,268.57,236.64,226.81,298.72,273.39,308.88,327.48
2022-03-12,54070.38,7326.24,239.86,234.1,276.68,251.79,292.16,259.31,272.83,251.75,281.25,224.42,276.49,276.99
2022-03-13,52054.83,8066.67,210.2,180.07,190.92,135.17,269.57,305.08,205.56,200.8,225.14,243.8,284.4,342.22
2022-03-14,58380.0,4546.08,269.38,308.3,337.24,285.94,371.9,358.64,257.14,284.79,325.97,260.12,366.94,312.64
2022-03-15,56406.79,3537.89,298.9,328.61,374.67,320.45,404.6,359.18,243.95,289.07,315.94,281.23,348.16,296.29
2022-03-16,55086.96,3887.02,274.84,294.77,318.14,274.91,332.07,297.43,248.08,275.72,287.98,272.3,303.96,281.94
2022-03-17,57081.08,6355.05,219.66,257.65,304.92,261.0,312.86,285.97,236.95,233.5,283.22,252.62,296.02,259.27
2022-03-18,57270.83,8754.2,224.7,243.19,257.24,208.06,247.77,237.12,207.1,245.36,252.18,211.43,256.98,229.9
"""

data = pd.read_csv(StringIO(CSV), parse_dates=["date"])


price_plots = [hv.Scatter(data, kdims=["date"], vdims=column, label=column).opts(legend_position="right", height=500) for column in PRICE_COLUMNS]
price_plot = hv.Overlay(price_plots).opts(ylabel="Price")

production_plot = data.hvplot(x="date", y=DEMAND_COLUMNS, kind="scatter", height=300, ylabel="production")

pn.Column(
    price_plot,
    production_plot
).servable()

axes-works

Add value_label to your hvplot call.

price_plot = data.hvplot(x="date", y=PRICE_COLUMNS, kind="scatter", height=500, value_label="Price")
production_plot = data.hvplot(x="date", y=DEMAND_COLUMNS, kind="scatter", height=300, value_label="Demand")

2 Likes