How do I plot country flows onto a map

Hi

I have the below two data frames that I would like to visualize on a map.

I would like

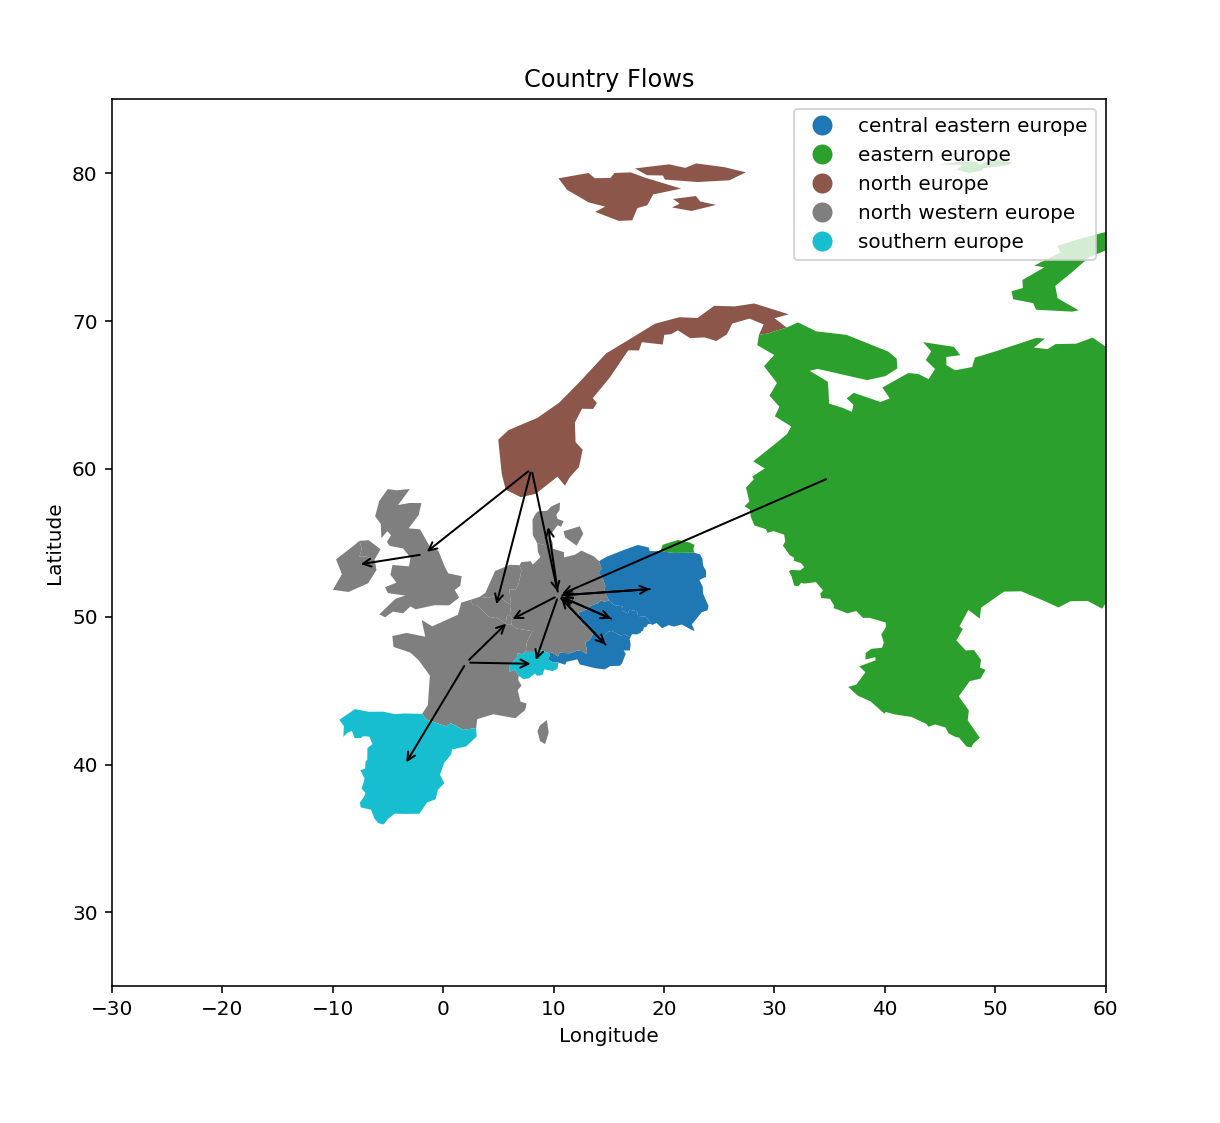
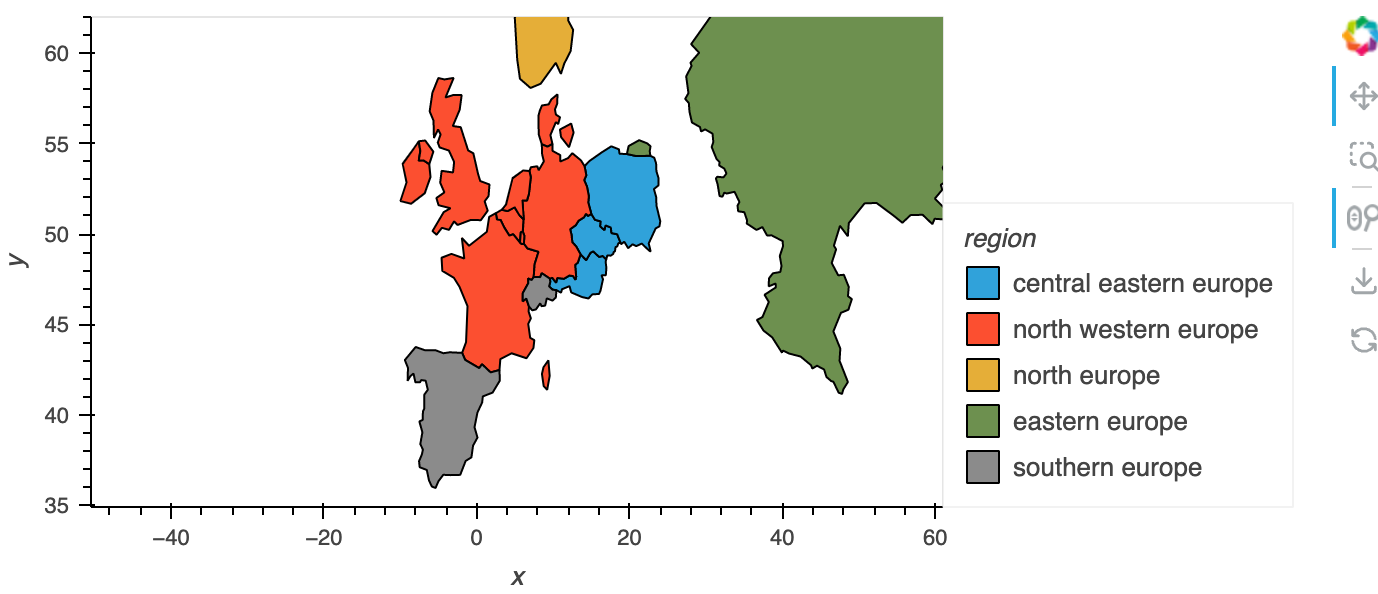
  • A map that shows all the country
  • Each country should be colored by its region
  • It would be nice to have an arrow pointing from from_country to the to_country.
  • It would be nice to be able to later add interactivity (click selection, tooltips) etc. to the map.

How would I do that

import pandas as pd

countries = pd.DataFrame(
    [
        {"country": "austria", "region": "central eastern europe"},
        {"country": "belgium", "region": "north western europe"},
        {"country": "czech", "region": "central eastern europe"},
        {"country": "denmark", "region": "north western europe"},
        {"country": "france", "region": "north western europe"},
        {"country": "germany", "region": "north western europe"},
        {"country": "great britain", "region": "north western europe"},
        {"country": "ireland", "region": "north western europe"},
        {"country": "luxemborg", "region": "north western europe"},
        {"country": "netherlands", "region": "north western europe"},
        {"country": "norway", "region": "north europe"},
        {"country": "poland", "region": "central eastern europe"},
        {"country": "russia", "region": "eastern europe"},
        {"country": "spain", "region": "southern europe"},
        {"country": "switzerland", "region": "southern europe"},
    ]
)
country_flows = pd.DataFrame(
    [
        {"from_country": "austria", "to_country": "germany"},
        {"from_country": "czech", "to_country": "germany"},
        {"from_country": "france", "to_country": "luxemborg"},
        {"from_country": "france", "to_country": "spain"},
        {"from_country": "france", "to_country": "switzerland"},
        {"from_country": "germany", "to_country": "austria"},
        {"from_country": "germany", "to_country": "czech"},
        {"from_country": "germany", "to_country": "denmark"},
        {"from_country": "germany", "to_country": "luxemborg"},
        {"from_country": "germany", "to_country": "poland"},
        {"from_country": "germany", "to_country": "switzerland"},
        {"from_country": "great britain", "to_country": "great britain"},
        {"from_country": "great britain", "to_country": "ireland"},
        {"from_country": "netherlands", "to_country": "netherlands"},
        {"from_country": "norway", "to_country": "belgium"},
        {"from_country": "norway", "to_country": "germany"},
        {"from_country": "norway", "to_country": "great britain"},
        {"from_country": "poland", "to_country": "germany"},
        {"from_country": "russia", "to_country": "germany"},
    ]
)

First step is a static matplotlib plot

import pandas as pd

countries = pd.DataFrame(
    [
        {"country": "austria", "region": "central eastern europe"},
        {"country": "belgium", "region": "north western europe"},
        {"country": "czech", "region": "central eastern europe"},
        {"country": "denmark", "region": "north western europe"},
        {"country": "france", "region": "north western europe"},
        {"country": "germany", "region": "north western europe"},
        {"country": "great britain", "region": "north western europe"},
        {"country": "ireland", "region": "north western europe"},
        {"country": "luxemborg", "region": "north western europe"},
        {"country": "netherlands", "region": "north western europe"},
        {"country": "norway", "region": "north europe"},
        {"country": "poland", "region": "central eastern europe"},
        {"country": "russia", "region": "eastern europe"},
        {"country": "spain", "region": "southern europe"},
        {"country": "switzerland", "region": "southern europe"},
    ]
)
countries = countries.sort_values("country")
country_flows = pd.DataFrame(
    [
        {"from_country": "austria", "to_country": "germany"},
        {"from_country": "czech", "to_country": "germany"},
        {"from_country": "france", "to_country": "luxemborg"},
        {"from_country": "france", "to_country": "spain"},
        {"from_country": "france", "to_country": "switzerland"},
        {"from_country": "germany", "to_country": "austria"},
        {"from_country": "germany", "to_country": "czech"},
        {"from_country": "germany", "to_country": "denmark"},
        {"from_country": "germany", "to_country": "luxemborg"},
        {"from_country": "germany", "to_country": "poland"},
        {"from_country": "germany", "to_country": "switzerland"},
        {"from_country": "great britain", "to_country": "great britain"},
        {"from_country": "great britain", "to_country": "ireland"},
        {"from_country": "netherlands", "to_country": "netherlands"},
        {"from_country": "norway", "to_country": "belgium"},
        {"from_country": "norway", "to_country": "germany"},
        {"from_country": "norway", "to_country": "great britain"},
        {"from_country": "poland", "to_country": "germany"},
        {"from_country": "russia", "to_country": "germany"},
    ]
)
country_flows = country_flows.sort_values(by=["from_country", "to_country"])
import geopandas as gpd
import matplotlib.pyplot as plt
import matplotlib.cm as cm

# Load the world map shapefile
world_map = gpd.read_file(gpd.datasets.get_path("naturalearth_lowres"))
world_map = world_map[world_map["continent"] == "Europe"]
bbox = [-30, 25, 60, 85]  # [minx, miny, maxx, maxy]
# europe_russia_map = world_map.cx[bbox[0] : bbox[2], bbox[1] : bbox[3]]
world_map = world_map.sort_values("name")
world_map["lower_name"] = world_map["name"].str.lower()
world_map.lower_name = world_map.lower_name.replace(
    {"czechia": "czech", "united kingdom": "great britain", "luxembourg": "luxemborg"}
)
# Merge the countries data frame with the world map data
merged_data = world_map.merge(countries, left_on="lower_name", right_on="country")

# Create a new column 'region_color' based on the 'region' column
merged_data["region_color"] = merged_data["region"].map(
    {
        "central eastern europe": "red",
        "north western europe": "blue",
        "north europe": "green",
        "eastern europe": "purple",
        "southern europe": "orange",
    }
)
assert len(merged_data) == len(countries)

# Plot the map with colored regions
fig, ax = plt.subplots(figsize=(16, 8))
merged_data.plot(
    ax=ax,
    column="region",
    legend=True,
)

# Manually specify the from_coords and to_coords as dictionaries
country_coords = (
    merged_data.set_index("country")["geometry"]
    .apply(lambda x: x.representative_point().coords[:][0])
    .to_dict()
)
country_cords_manual = {"russia": (35, 59.40587000000008), "norway": (8, 60)}
country_coords = {**country_coords, **country_cords_manual}
print(country_coords)

# Add arrows between countries
for _, row in country_flows.iterrows():
    from_country = row["from_country"]
    to_country = row["to_country"]

    from_coords = country_coords[from_country]
    to_coords = country_coords[to_country]
    ax.annotate(
        "",
        xy=to_coords,
        xytext=from_coords,
        arrowprops=dict(arrowstyle="->", color="black"),
    )

# Set plot title and axis labels
ax.set_title("Country Flows")
ax.set_xlabel("Longitude")
ax.set_ylabel("Latitude")
ax.set_xlim(bbox[0], bbox[2])
ax.set_ylim(bbox[1], bbox[3])

# Show the plot
import panel as pn

pn.panel(fig).servable()

Looks like

What I woud like to be able to do is

  • Use the region_color to color the map. But keep the region names in the legend.
  • Have an interactive Bokeh/ Plotly plot created via HoloViews if possible.
import pandas as pd
import geopandas as gpd
import hvplot.pandas


# Load the world map shapefile
world_map = gpd.read_file(gpd.datasets.get_path("naturalearth_lowres"))
world_map = world_map[world_map["continent"] == "Europe"]
bbox = [-30, 25, 60, 85]  # [minx, miny, maxx, maxy]

# europe_russia_map = world_map.cx[bbox[0] : bbox[2], bbox[1] : bbox[3]]
world_map = world_map.sort_values("name")
world_map["lower_name"] = world_map["name"].str.lower()
world_map.lower_name = world_map.lower_name.replace(
    {"czechia": "czech", "united kingdom": "great britain", "luxembourg": "luxemborg"}
)

# Merge the countries data frame with the world map data
countries = pd.DataFrame(
    [
        {"country": "austria", "region": "central eastern europe"},
        {"country": "belgium", "region": "north western europe"},
        {"country": "czech", "region": "central eastern europe"},
        {"country": "denmark", "region": "north western europe"},
        {"country": "france", "region": "north western europe"},
        {"country": "germany", "region": "north western europe"},
        {"country": "great britain", "region": "north western europe"},
        {"country": "ireland", "region": "north western europe"},
        {"country": "luxemborg", "region": "north western europe"},
        {"country": "netherlands", "region": "north western europe"},
        {"country": "norway", "region": "north europe"},
        {"country": "poland", "region": "central eastern europe"},
        {"country": "russia", "region": "eastern europe"},
        {"country": "spain", "region": "southern europe"},
        {"country": "switzerland", "region": "southern europe"},
    ]
)

country_flows = pd.DataFrame(
    [
        {"from_country": "austria", "to_country": "germany"},
        {"from_country": "czech", "to_country": "germany"},
        {"from_country": "france", "to_country": "luxemborg"},
        {"from_country": "france", "to_country": "spain"},
        {"from_country": "france", "to_country": "switzerland"},
        {"from_country": "germany", "to_country": "austria"},
        {"from_country": "germany", "to_country": "czech"},
        {"from_country": "germany", "to_country": "denmark"},
        {"from_country": "germany", "to_country": "luxemborg"},
        {"from_country": "germany", "to_country": "poland"},
        {"from_country": "germany", "to_country": "switzerland"},
        {"from_country": "great britain", "to_country": "great britain"},
        {"from_country": "great britain", "to_country": "ireland"},
        {"from_country": "netherlands", "to_country": "netherlands"},
        {"from_country": "norway", "to_country": "belgium"},
        {"from_country": "norway", "to_country": "germany"},
        {"from_country": "norway", "to_country": "great britain"},
        {"from_country": "poland", "to_country": "germany"},
        {"from_country": "russia", "to_country": "germany"},
    ]
)

geoms = world_map.merge(countries, left_on="lower_name", right_on="country")
geoms.hvplot(by="region", tools=["hover"])

Here’s the start of hvplot without the arrows.

1 Like