kcpevey
September 22, 2020, 1:52pm
1
From the docs:
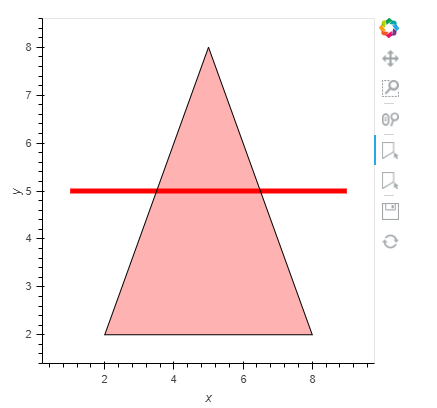
import holoviews as hv
from holoviews import streams, opts
path = hv.Path([[(1, 5), (9, 5)]])
poly = hv.Polygons([[(2, 2), (5, 8), (8, 2)]])
path_stream = streams.PolyDraw(source=path, drag=True, show_vertices=True)
poly_stream = streams.PolyDraw(source=poly, drag=True, num_objects=4,
                               show_vertices=True, styles={
                                   'fill_color': ['red', 'green', 'blue']
                               })

(path * poly).opts(
    opts.Path(color='red', height=400, line_width=5, width=400),
    opts.Polygons(fill_alpha=0.3, active_tools=['poly_draw']))
Now suppose I want to programmatically change the polygon topoly2 = hv.Polygons([[(1, 1), (4, 4), (8, 2)]])
How would I do that?
If you do this:poly_stream.source = poly2poly like you did originally, you don’t get the drawing tools. You’d have to view poly2 which would cause me to do a complete image reload.
This of course is terribly inefficient. Is there a better way that would allow me to modify the drawing without reload?
Marc
September 25, 2020, 3:29am
3
Ahh. I need to add hv.extension('bokeh').
import holoviews as hv
from holoviews import streams, opts
import panel as pn
hv.extension('bokeh')
path = hv.Path([[(1, 5), (9, 5)]])
poly = hv.Polygons([[(2, 2), (5, 8), (8, 2)]])
path_stream = streams.PolyDraw(source=path, drag=True, show_vertices=True)
poly_stream = streams.PolyDraw(source=poly, drag=True, num_objects=4,
                               show_vertices=True, styles={
                                   'fill_color': ['red', 'green', 'blue']
                               })

plot = (path * poly).opts(
    opts.Polygons(fill_alpha=0.3, active_tools=['poly_draw']),
    opts.Path(color='red', height=400, line_width=5, width=400),
    )

pn.Column(plot).servable()
Marc
September 25, 2020, 3:51am
4
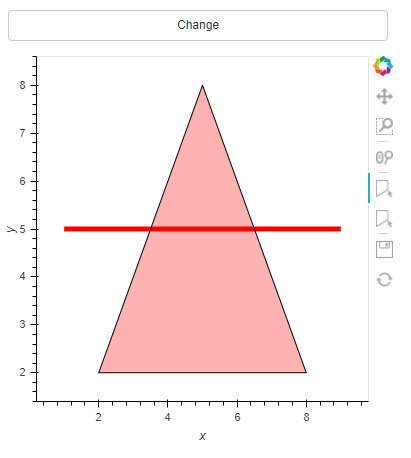
I would have expected something like the below to work. But nothing happens when I click the button.
import holoviews as hv
from holoviews import streams, opts
import panel as pn
hv.extension('bokeh')
path = hv.Path([[(1, 5), (9, 5)]])
poly = hv.Polygons([[(2, 2), (5, 8), (8, 2)]])
path_stream = streams.PolyDraw(source=path, drag=True, show_vertices=True)
poly_stream = streams.PolyDraw(source=poly, drag=True, num_objects=4,
                               show_vertices=True, styles={
                                   'fill_color': ['red', 'green', 'blue']
                               })

plot = (path * poly).opts(
    opts.Polygons(fill_alpha=0.3, active_tools=['poly_draw']),
    opts.Path(color='red', height=400, line_width=5, width=400),
    )
def update(*_):
    print(poly.data)
    poly.data = [[(1, 1), (4, 4), (8, 2)]]
    print(poly.data)

button = pn.widgets.Button(name="Change")
button.on_click(callback=update)

pn.Column(button, plot).servable()
I’ve also tried to disable the streams but still clicking the button does change anything.
Marc
September 25, 2020, 4:28am
5
Something like the below reset the poly. But I don’t know if you want to keep anything the user has drawn?
from os import linesep
import holoviews as hv
from holoviews import streams, opts
import panel as pn
from random import randint

LINE = "red"
FILL1 = "green"
FILL2 = "fulvous"
FILL3 = "blue"

hv.extension('bokeh')
path = hv.Path([[(1, 5), (9, 5)]])
poly = hv.Polygons([[(2, 2), (5, 8), (8, 2)]])
path_stream = streams.PolyDraw(source=path, drag=True, show_vertices=True)
poly_stream = streams.PolyDraw(source=poly, drag=True, num_objects=4,
                               show_vertices=True, styles={
                                   'fill_color': [FILL1, FILL2, FILL3]
                               })

def get_plot(path, poly):
    return (path * poly).opts(
        opts.Polygons(fill_alpha=0.3, active_tools=['poly_draw']),
        opts.Path(color=LINE, height=400, line_width=5, width=400),
        )
plot = get_plot(path,poly)
plot_pane = pn.pane.HoloViews(plot)

def update(*_):
    poly2 = hv.Polygons([[(randint(2,5), randint(6,9)), (4, 4), (8, 2)]])
    poly_stream.source = poly2
    plot_pane.object = get_plot(path, poly2)

button = pn.widgets.Button(name="RANDOM RESET")
button.on_click(callback=update)

pn.Column(plot_pane,  button).servable()
This is great!