I’m working with actual and forecasted data. The focus is the actual data end how the forecasted deviates from this. So I create a plot like this.
import pandas as pd
import hvplot.pandas
df = pd.DataFrame(
{
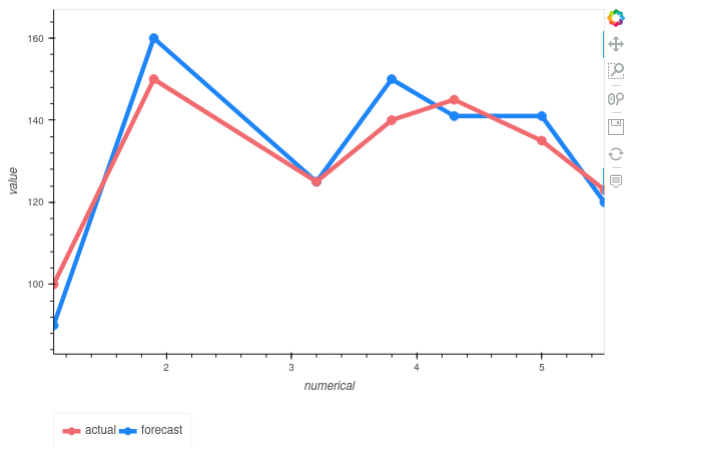
"actual": [100, 150, 125, 140, 145, 135, 123],
"forecast": [90, 160, 125, 150, 141, 141, 120],
"numerical": [1.1, 1.9, 3.2, 3.8, 4.3, 5.0, 5.5],
"date": pd.date_range("2022-01-03", "2022-01-09"),
"string": ["Mon", "Tue", "Wed", "Thu", "Fri", "Sat", "Sun"],
},
)
line = df.hvplot.line(x="numerical", y=["forecast", "actual"], ylabel="value", legend="bottom", height=500, color=["#1e85f7", "#f16a6f"], line_width=5)
markers = df.hvplot.scatter(
x="numerical", y=["forecast", "actual"], color=["#1e85f7", "#f16a6f"], size=100
)
line * markers
It looks like

I set y=["forecast", "actual"] to put the actual series on top of the forecast series.
How do I put the forecast series first in the legend?
(Hopefully without jumping into Holoviews and/ or using hooks.)