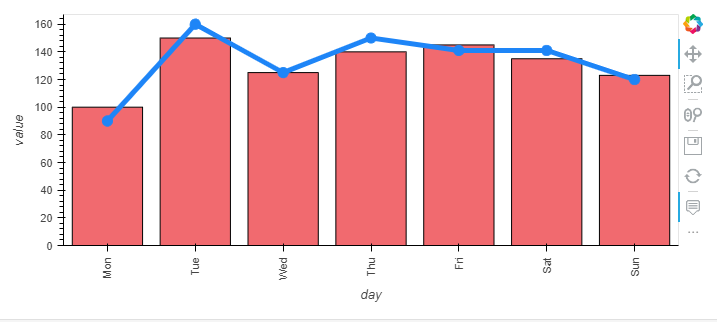
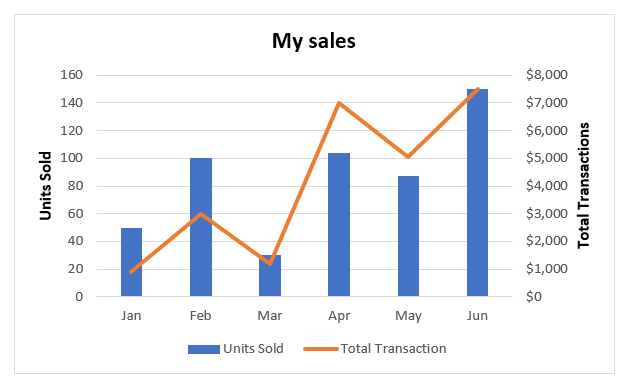
Sometimes in business context a bar chart and a line chart are overlayed. For example excel users do this all the time
I tried to do this but I cannot figure out how to show the legend. It seems not to work. According to the Bar reference guide I should just set legend to something to get it to show.
import pandas as pd
import hvplot.pandas

df = pd.DataFrame(
    {
        "actual": [100, 150, 125, 140, 145, 135, 123],
        "forecast": [90, 160, 125, 150, 141, 141, 120],
        "numerical": [1.1, 1.9, 3.2, 3.8, 4.3, 5.0, 5.5],
        "date": pd.date_range("2022-01-03", "2022-01-09"),
        "string": ["Mon", "Tue", "Wed", "Thu", "Fri", "Sat", "Sun"],
    },
)
bar = df.hvplot.bar(x="string", y="actual", rot=90, color="#f16a6f", legend="bottom", xlabel="day", ylabel="value")
bar
does not show the legend

I cannot get it to show when I overlay a line plot with markers.
forecast_line = df.hvplot.line(x="string", y="forecast", color="#1e85f7", line_width=5, legend="bottom")
forecast_markers = df.hvplot.scatter(x="string", y="forecast", color="#1e85f7", size=100, legend="bottom")
bar * forecast_line * forecast_markers