How to add an extra variable to hover on image or contourf plot?

Hi,

I am trying to add extra variables (from a Xarray Dataset) in the hover of a image or contourf plot.

Here is a reproducible example:

import xarray as xr
import hvplot.xarray  # noqa

import holoviews as hv
from holoviews import opts
hv.extension('bokeh')

air_ds = xr.tutorial.open_dataset('air_temperature').load()
meanairbyyear = air_ds.air.groupby('time.year').mean()
stdairbyyear = air_ds.air.groupby('time.year').std()

meanair2d = xr.Dataset(
    {
        "y2013": (["lat", "lon"], meanairbyyear[0,:,:]),
        "y2014": (["lat", "lon"], meanairbyyear[1,:,:]),
    },
    coords={
        "lon": ("lon", meanairbyyear.lon),
        "lat": ("lat", meanairbyyear.lat),
    },
)

meanair2d

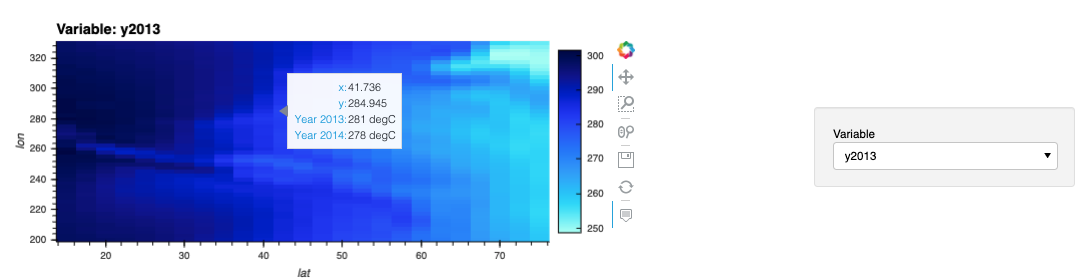
pl=meanair2d.hvplot.image(z='y2013',width=400)

from bokeh.models import HoverTool
MyHover = HoverTool(
    tooltips=[
        ( 'x', '$x'),
        ( 'y', '$y'),
        ( 'Year 2013', '@image{%3.0f} degC'),
        ( 'Year 2014', '@y2014{%3.0f} degC'),        
   ],
    formatters={
        '$x' : 'numeral',
        '$y' : 'numeral',
        '@image' : 'printf',
        '@y2014' : 'printf',        
    },
    point_policy="follow_mouse"
)

pl.opts(tools = [MyHover])

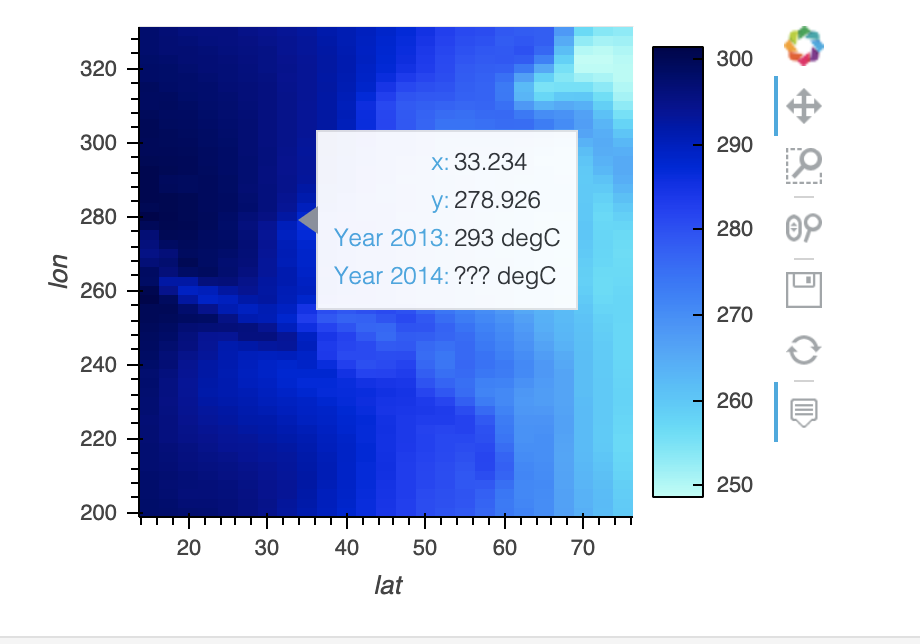
I would like to display the value of y2014 in addition to the one from y2013. With the code above I have ??? displayed for the variable y2014.

Any idea how to tackle this?

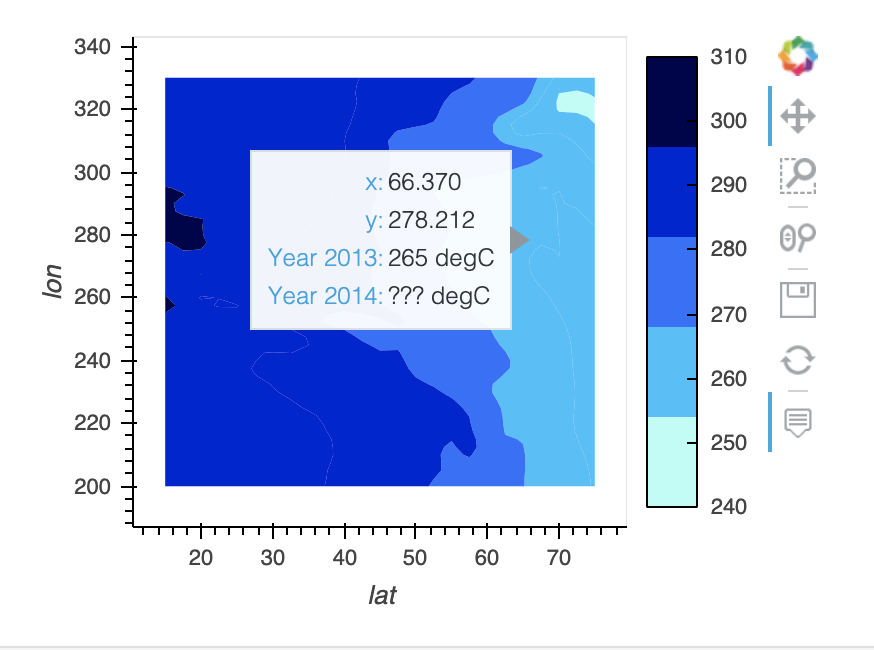
I have the same problem when plotting with contourf:

pl=meanair2d.hvplot.contourf(z='y2013',width=400)

from bokeh.models import HoverTool
MyHover2 = HoverTool(
    tooltips=[
        ( 'x', '$x'),
        ( 'y', '$y'),
        ( 'Year 2013', '@y2013{%3.0f} degC'),
        ( 'Year 2014', '@y2014{%3.0f} degC'),        
   ],
    formatters={
        '$x' : 'numeral',
        '$y' : 'numeral',
        '@y2013' : 'printf',
        '@y2014' : 'printf',        
    },
    point_policy="follow_mouse"
)


pl.opts(tools = [MyHover2])

Thank you!

Try adding the desired variable to hover_cols.

1 Like

Thank you @ahuang11 for your quick reply! I should have said I try adding hover_cols but it doesnt work. When I run this code:

pl=meanair2d.hvplot.image(z='y2013',width=400,hover_cols=['y2013','y2014'])

I have this error message:

---------------------------------------------------------------------------
DataError                                 Traceback (most recent call last)
<ipython-input-7-8bf5f00e6578> in <module>
----> 1 pl=meanair2d.hvplot.image(z='y2013',width=400,hover_cols=['y2013','y2014'])
      2 
      3 from bokeh.models import HoverTool
      4 MyHover = HoverTool(
      5     tooltips=[

~/opt/anaconda3/envs/analysis_eel_data/lib/python3.9/site-packages/hvplot/plotting/core.py in image(self, x, y, z, colorbar, **kwds)
    625             The HoloViews representation of the plot.
    626         """
--> 627         return self(x, y, z=z, kind='image', colorbar=colorbar, **kwds)
    628 
    629     def rgb(self, x=None, y=None, z=None, bands=None, **kwds):

~/opt/anaconda3/envs/analysis_eel_data/lib/python3.9/site-packages/hvplot/plotting/core.py in __call__(self, x, y, kind, **kwds)
     77                 return pn.panel(plot, **panel_dict)
     78 
---> 79         return self._get_converter(x, y, kind, **kwds)(kind, x, y)
     80 
     81     def _get_converter(self, x=None, y=None, kind=None, **kwds):

~/opt/anaconda3/envs/analysis_eel_data/lib/python3.9/site-packages/hvplot/converter.py in __call__(self, kind, x, y)
   1048                         dataset = Dataset(data)
   1049                     dataset = dataset.redim(**self._redim)
-> 1050                 obj = method(x, y)
   1051                 obj._dataset = dataset
   1052 

~/opt/anaconda3/envs/analysis_eel_data/lib/python3.9/site-packages/hvplot/converter.py in image(self, x, y, z, data)
   1693         element = self._get_element('image')
   1694         if self.geo: params['crs'] = self.crs
-> 1695         return element(data, [x, y], z, **params).redim(**redim).opts(**opts)
   1696 
   1697     def rgb(self, x=None, y=None, z=None, data=None):

~/opt/anaconda3/envs/analysis_eel_data/lib/python3.9/site-packages/holoviews/element/raster.py in __init__(self, data, kdims, vdims, bounds, extents, xdensity, ydensity, rtol, **params)
    290             params['rtol'] = config.image_rtol
    291 
--> 292         Dataset.__init__(self, data, kdims=kdims, vdims=vdims, extents=extents, **params)
    293         if not self.interface.gridded:
    294             raise DataError("%s type expects gridded data, %s is columnar. "

~/opt/anaconda3/envs/analysis_eel_data/lib/python3.9/site-packages/holoviews/core/data/__init__.py in __init__(self, data, kdims, vdims, **kwargs)
    339         (data, self.interface, dims, extra_kws) = initialized
    340         super(Dataset, self).__init__(data, **dict(kwargs, **dict(dims, **extra_kws)))
--> 341         self.interface.validate(self, validate_vdims)
    342 
    343         # Handle _pipeline property

~/opt/anaconda3/envs/analysis_eel_data/lib/python3.9/site-packages/holoviews/core/data/xarray.py in validate(cls, dataset, vdims)
    214         import xarray as xr
    215         if isinstance(dataset.data, xr.Dataset):
--> 216             Interface.validate(dataset, vdims)
    217         else:
    218             not_found = [kd.name for kd in dataset.kdims if kd.name not in dataset.data.coords]

~/opt/anaconda3/envs/analysis_eel_data/lib/python3.9/site-packages/holoviews/core/data/interface.py in validate(cls, dataset, vdims)
    314                      if d not in dataset.data]
    315         if not_found:
--> 316             raise DataError("Supplied data does not contain specified "
    317                             "dimensions, the following dimensions were "
    318                             "not found: %s" % repr(not_found), cls)

DataError: Supplied data does not contain specified dimensions, the following dimensions were not found: ['y2014']

Interface expects tabular data, for more information on supported datatypes see http://holoviews.org/user_guide/Tabular_Datasets.html

Maybe is it because xarray is not considered as a “Tabular Datasets”? @philippjfr @jbednar Do you have an idea?

I think I used it for pcolormesh before; make sure it’s listed as a variable not as a coordinate of the xarray dataset.

Actually might not be what I remembered:

Maybe you can pass multiple values to z.
z=[‘y2013’, ‘y2014’]

1 Like

Oh great! Thank you very much @ahuang11. It works perfectly well if I pass multiple values to z and add the hover_cols options:

pl=meanair2d.hvplot.image(z=['y2013','y2014'],hover_cols=['y2013','y2014'])

give me this result:

1 Like

Hi,

Is there a way to not get the menu on the right of the plot?

So, I want to see the data in when I hover my mouse over a point, but I d not wish to have an extra menu selection.

Is there a way to hide it?

Thanks!

Yes if you subset your data so there’s no more extra dimensions.

e.g. if you have time, lat, lon, select time=0 so only lat/lon remains.

Yes, I already had subset my data. So, I was using x=lon, y=lat and z=var and had no menu with my graph.

However, I wanted to see the data from my other plots when I hover over my plot. Thus,I added another variable to z, but since then I get the menu selection to the right of my plot, which I did not had previously.

So, now I have x=lon, y=lat and z=[var1,var2].

Sorry, I don’t fully understand. Can you create a similar example that illustrates your issue using this as a starting point?

import xarray as xr
import hvplot.xarray  # noqa

import holoviews as hv
from holoviews import opts
hv.extension('bokeh')

air_ds = xr.tutorial.open_dataset('air_temperature').load()