Oh great! Thank you very much @ahuang11. It works perfectly well if I pass multiple values to z and add the hover_cols options:
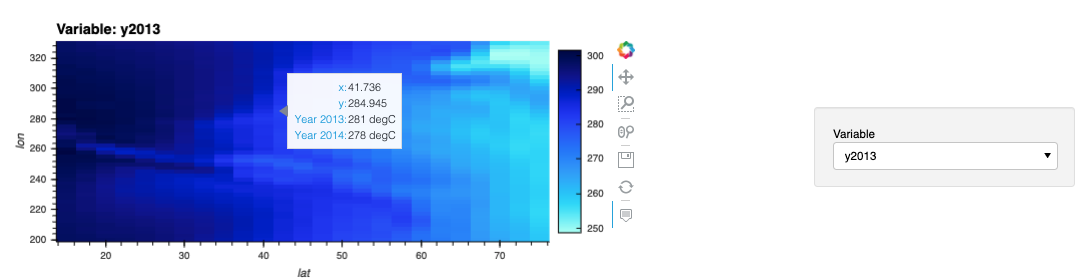
pl=meanair2d.hvplot.image(z=['y2013','y2014'],hover_cols=['y2013','y2014'])
give me this result:
Oh great! Thank you very much @ahuang11. It works perfectly well if I pass multiple values to z and add the hover_cols options:
pl=meanair2d.hvplot.image(z=['y2013','y2014'],hover_cols=['y2013','y2014'])
give me this result: