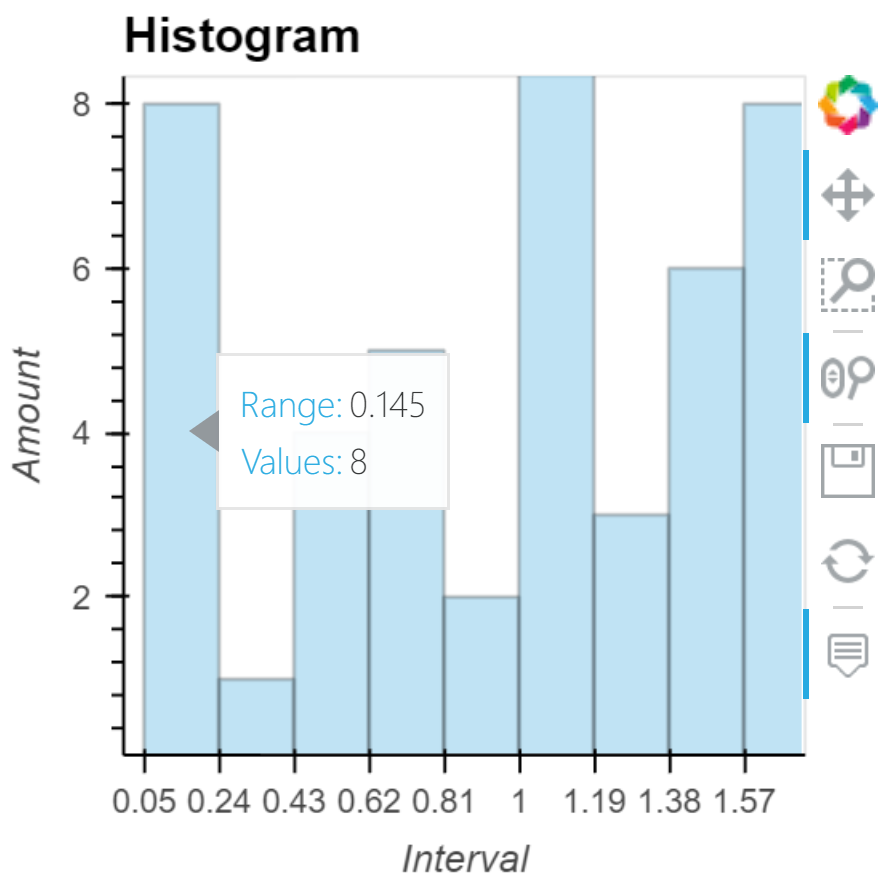
Hi, I want it so that when I click on one of the histograms, it will display every value in that range.
I also want it to print what those eight values are on hover.
If it could be in another windows is better.
Thank u guys!!!
This is my code:
import numpy as np
import holoviews as hv
from holoviews import opts
from bokeh.models import HoverTool
hv.extension('bokeh')

data = np.random.uniform(0, 2, size=50)
data = np.round(data, decimals=2)
hist, edges = np.histogram(data, bins=10)
hv_hist = hv.Histogram((hist, edges))

hover = HoverTool(
    tooltips=[
        ("Range", "@x"),
        ("Values", "@top"),
    ],
    formatters={"@x": "printf", "@y": "printf"},
)

hv_hist = hv_hist.opts(
    xlabel='Interval',
    ylabel='Amount',
    title='Histogram',
    xticks=edges,
    tools=[hover],
)

hv_hist
I also attempted to use a dictionary for the values and tried to create a function using dynamic map, but unfortunately, I encountered some difficulties and was unable to succeed.