How to capture the click event on Plotly plot with Panel?

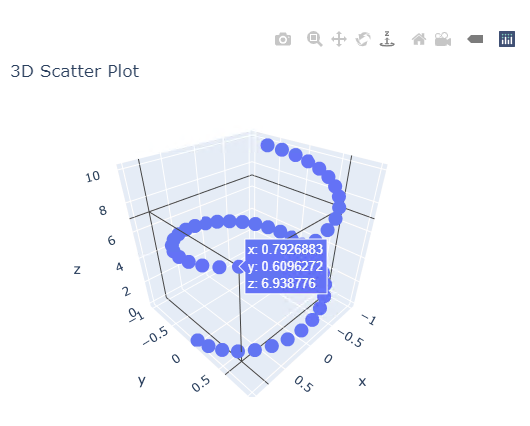
Below is a simple 3D scatter plot generated with Panel + Plotly in JupyterLab.
Does anyone how to capture the clicked coordinate (x,y,z) within the Plotly chart as shown below? I need to retrieve this (x,y,z) to drive a different plot. Thanks.

import numpy as np
import plotly.graph_objs as go
import panel as pn
pn.extension('plotly')


t = np.linspace(0, 10, 50)
x, y, z = np.cos(t), np.sin(t), t
fig = go.Figure(
    data=go.Scatter3d(x=x, y=y, z=z, mode='markers'),
    layout=dict(title='3D Scatter Plot')
)

pn.pane.Plotly(fig)

Screen Shot 2020-10-28 at 3.10.58 PM

1 Like

Hi @scoodood.

It’s a good question. You can use the click_data parameter on the Plotly pane.

It’s not directly documented in the Reference Guide. Feel free to create a FR or PR.!

Inspired by the last example in the Plotly reference guide and your code I created the below. It was just so fun and easy with the new templates. :slight_smile:

plotly_click

plotly_click|video

"""
Scoodood is asking on [Discourse](https://discourse.holoviz.org/t/how-to-capture-the-click-event-on-plotly-plot-with-panel/1360)

How to capture the click event on Plotly plot with Panel?
"""

import numpy as np
from panel.template.react import ReactTemplate
import plotly.graph_objs as go
import panel as pn

pn.extension("plotly")
pn.config.sizing_mode = "stretch_width"


def create_plot():
    t = np.linspace(0, 10, 50)
    x, y, z = np.cos(t), np.sin(t), t
    fig = go.Figure(
        data=go.Scatter3d(x=x, y=y, z=z, mode="markers"), layout=dict(title="3D Scatter Plot")
    )
    fig.layout.autosize = True
    return fig


def create_layout(plot):
    description_panel = pn.layout.Card(
        __doc__, header="# How to capture Plotly Click Events?", sizing_mode="stretch_both"
    )
    plot_panel = pn.pane.Plotly(plot, config={"responsive": True}, sizing_mode="stretch_both")
    settings_panel = plot_panel.controls(jslink=True)

    template = ReactTemplate(title="Awesome Panel - Plotly App")
    template.sidebar.append(settings_panel)
    template.main[0, :] = description_panel
    template.main[1:4, :] = plot_panel
    return template


def create_app():
    plot = create_plot()
    return create_layout(plot)


app = create_app()
app.servable()
1 Like

I did a little tweet about it. Feel free to share if you like.

2 Likes

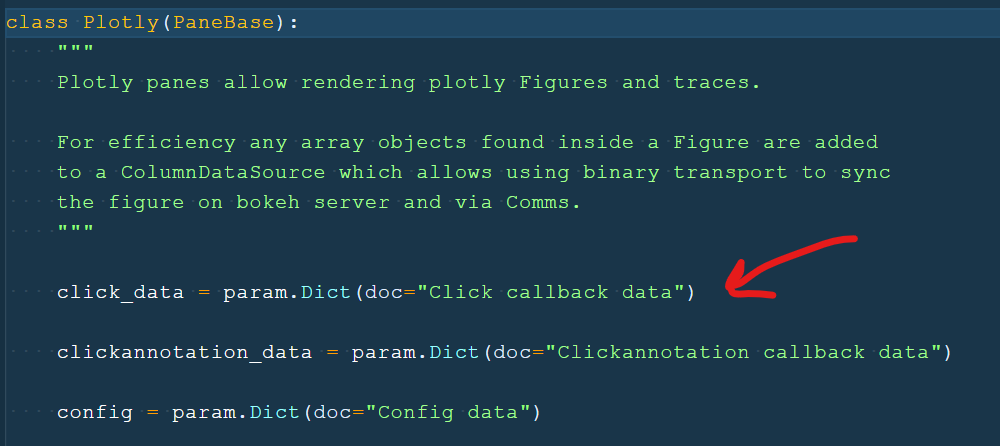
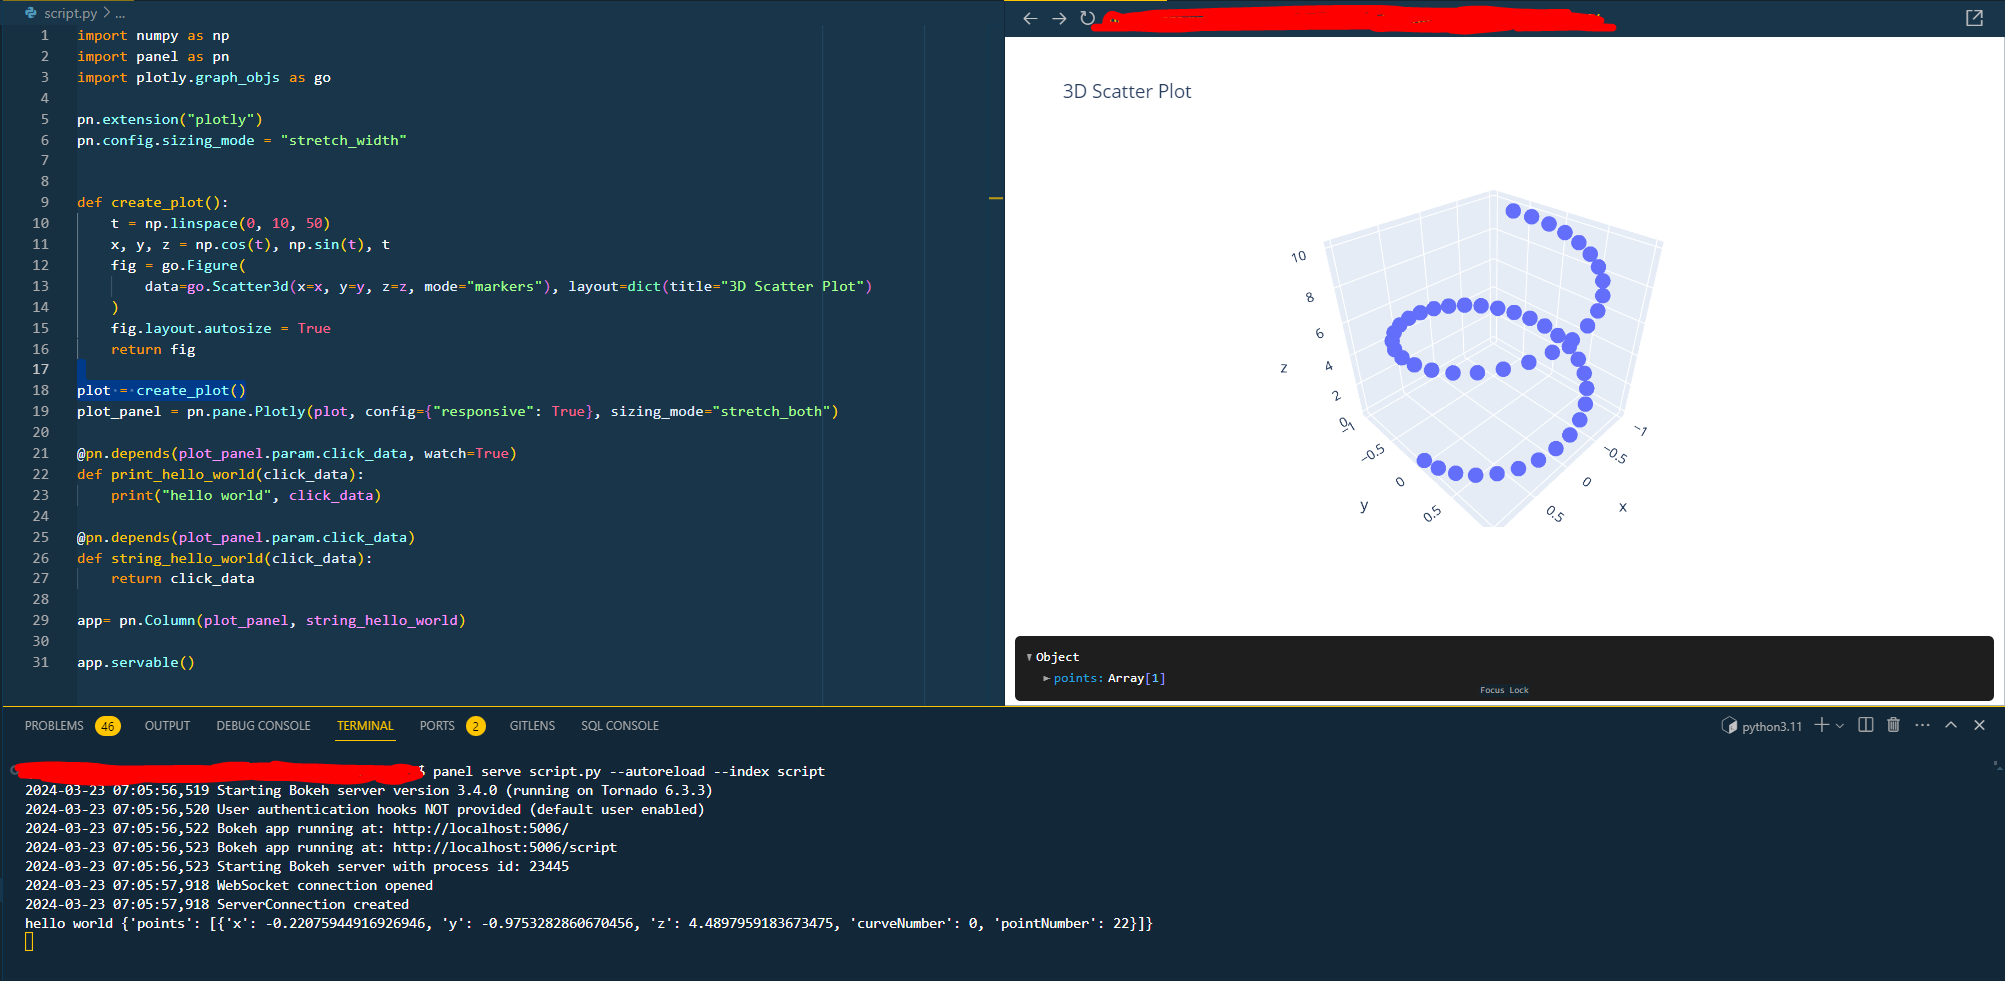
hi @Marc, thanks for the sample code. I am totally new to Panel. I have been trying to study your code and learn how to use param. But I am still not sure how to access the click_data. Can you please show me to how print “hello world” when the click_data is triggered? Thanks.

Hi @scoodood

Sure. Here you go

import numpy as np
import panel as pn
import plotly.graph_objs as go

pn.extension("plotly")
pn.config.sizing_mode = "stretch_width"


def create_plot():
    t = np.linspace(0, 10, 50)
    x, y, z = np.cos(t), np.sin(t), t
    fig = go.Figure(
        data=go.Scatter3d(x=x, y=y, z=z, mode="markers"), layout=dict(title="3D Scatter Plot")
    )
    fig.layout.autosize = True
    return fig

plot = create_plot()
plot_panel = pn.pane.Plotly(plot, config={"responsive": True}, sizing_mode="stretch_both")

@pn.depends(plot_panel.param.click_data, watch=True)
def print_hello_world(click_data):
    print("hello world", click_data)

@pn.depends(plot_panel.param.click_data)
def string_hello_world(click_data):
    return click_data

app= pn.Column(plot_panel, string_hello_world)

app.servable()
4 Likes

hi @Marc, wow this is a lot simpler than I thought. Thank you very much.

1 Like

Thanks for asking for a simple example. And thanks for your positive feedback.

Hi @Marc , thank you for providing this simple example. Is there a way to link this click event in Plotly 3D plot to a discrete slider? I wish to alter the values of a discrete slider based on the points I click on the 3D plot. Kindly let me know if there is a possible solution to this.

As always Mr. @Marc to the rescue. Does it work simlarly for a ds.hvplot(kind='quadmesh', ...) ?

1 Like

Hi @StuckDuckF

For hvPlot and HoloViews there is more possibilities. It is called Streams and documented here.

1 Like

Is this possible with the selected_data plotly param? See: Bind selected_data param from plotly chart

Hi @Marc

Thank you very much for your code.
I’m also new to panel and I’m struggling with it.
I tried to run your code but nothing shows up unless I add fig.show() or plot.show().
However, since the figure is displayed, I just have the 3D scatter plot without any cell popping below nore elements printing in the terminal.
What am I missing ?
Thank you in advance for your help

Hi @0ld6x

Welcome to the community. I can confirm the code still works with the latest versions of Panel and Plotly.

If you still have problems try creating a new post with the exact steps to reproduce your issue. Thx.