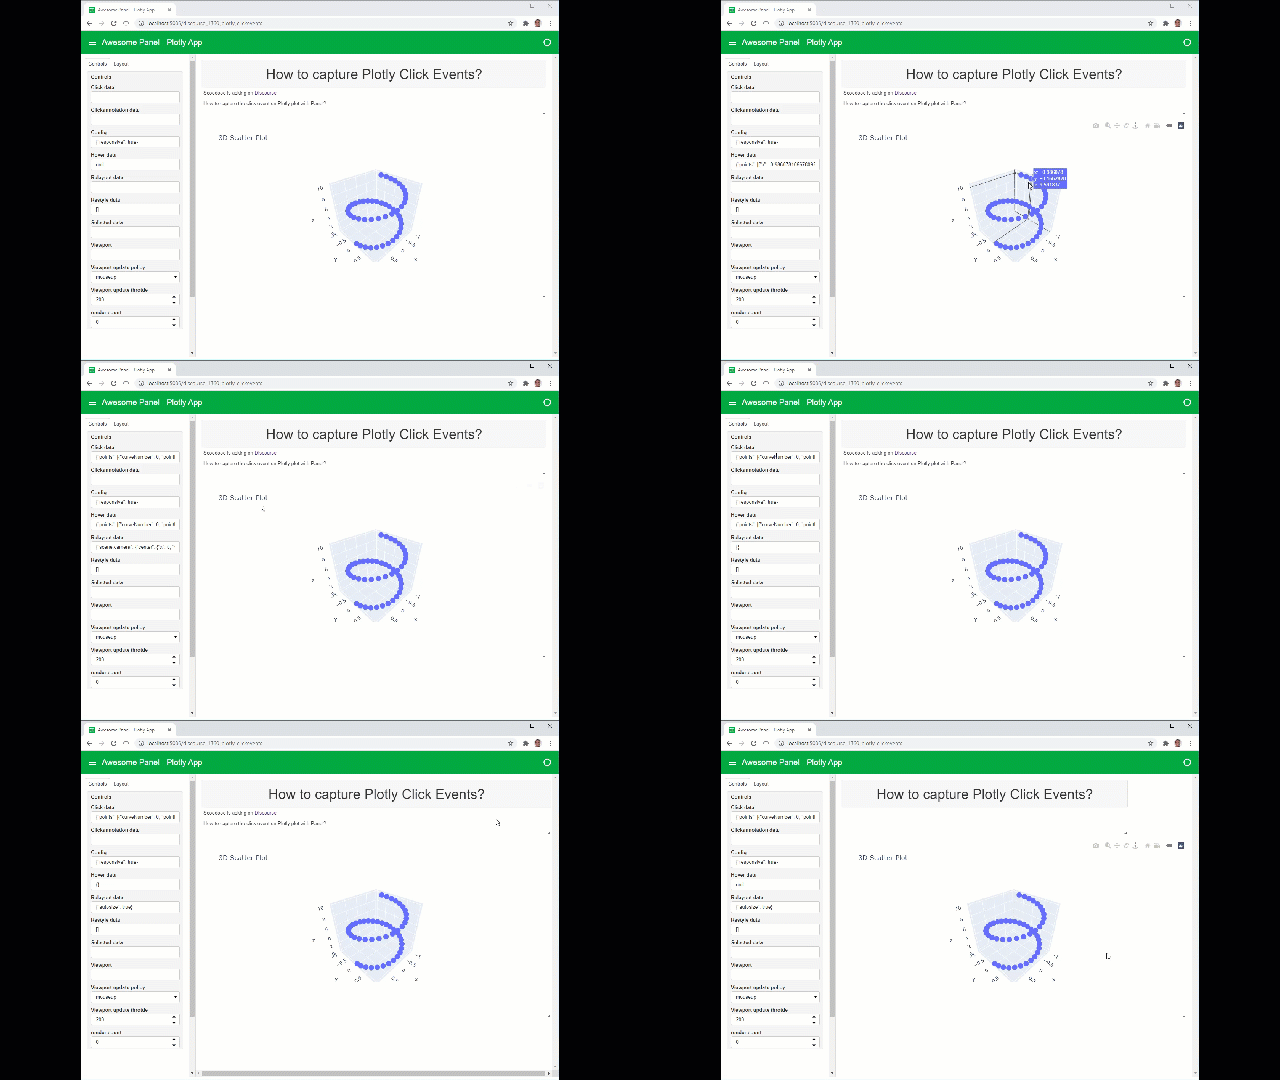
Hi @scoodood.
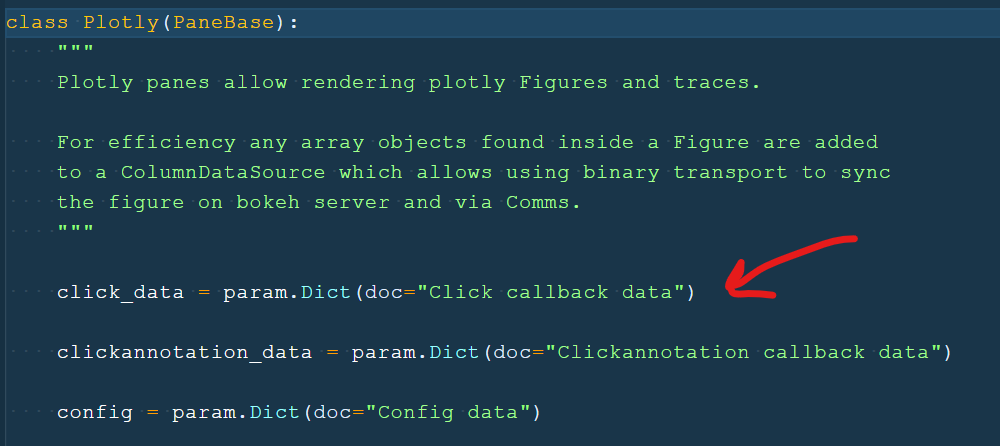
It’s a good question. You can use the click_data parameter on the Plotly pane.
It’s not directly documented in the Reference Guide. Feel free to create a FR or PR.!
Inspired by the last example in the Plotly reference guide and your code I created the below. It was just so fun and easy with the new templates. 

"""
Scoodood is asking on [Discourse](https://discourse.holoviz.org/t/how-to-capture-the-click-event-on-plotly-plot-with-panel/1360)

How to capture the click event on Plotly plot with Panel?
"""

import numpy as np
from panel.template.react import ReactTemplate
import plotly.graph_objs as go
import panel as pn

pn.extension("plotly")
pn.config.sizing_mode = "stretch_width"


def create_plot():
    t = np.linspace(0, 10, 50)
    x, y, z = np.cos(t), np.sin(t), t
    fig = go.Figure(
        data=go.Scatter3d(x=x, y=y, z=z, mode="markers"), layout=dict(title="3D Scatter Plot")
    )
    fig.layout.autosize = True
    return fig


def create_layout(plot):
    description_panel = pn.layout.Card(
        __doc__, header="# How to capture Plotly Click Events?", sizing_mode="stretch_both"
    )
    plot_panel = pn.pane.Plotly(plot, config={"responsive": True}, sizing_mode="stretch_both")
    settings_panel = plot_panel.controls(jslink=True)

    template = ReactTemplate(title="Awesome Panel - Plotly App")
    template.sidebar.append(settings_panel)
    template.main[0, :] = description_panel
    template.main[1:4, :] = plot_panel
    return template


def create_app():
    plot = create_plot()
    return create_layout(plot)


app = create_app()
app.servable()
