How to change order of data of points with non numeric x-axis?

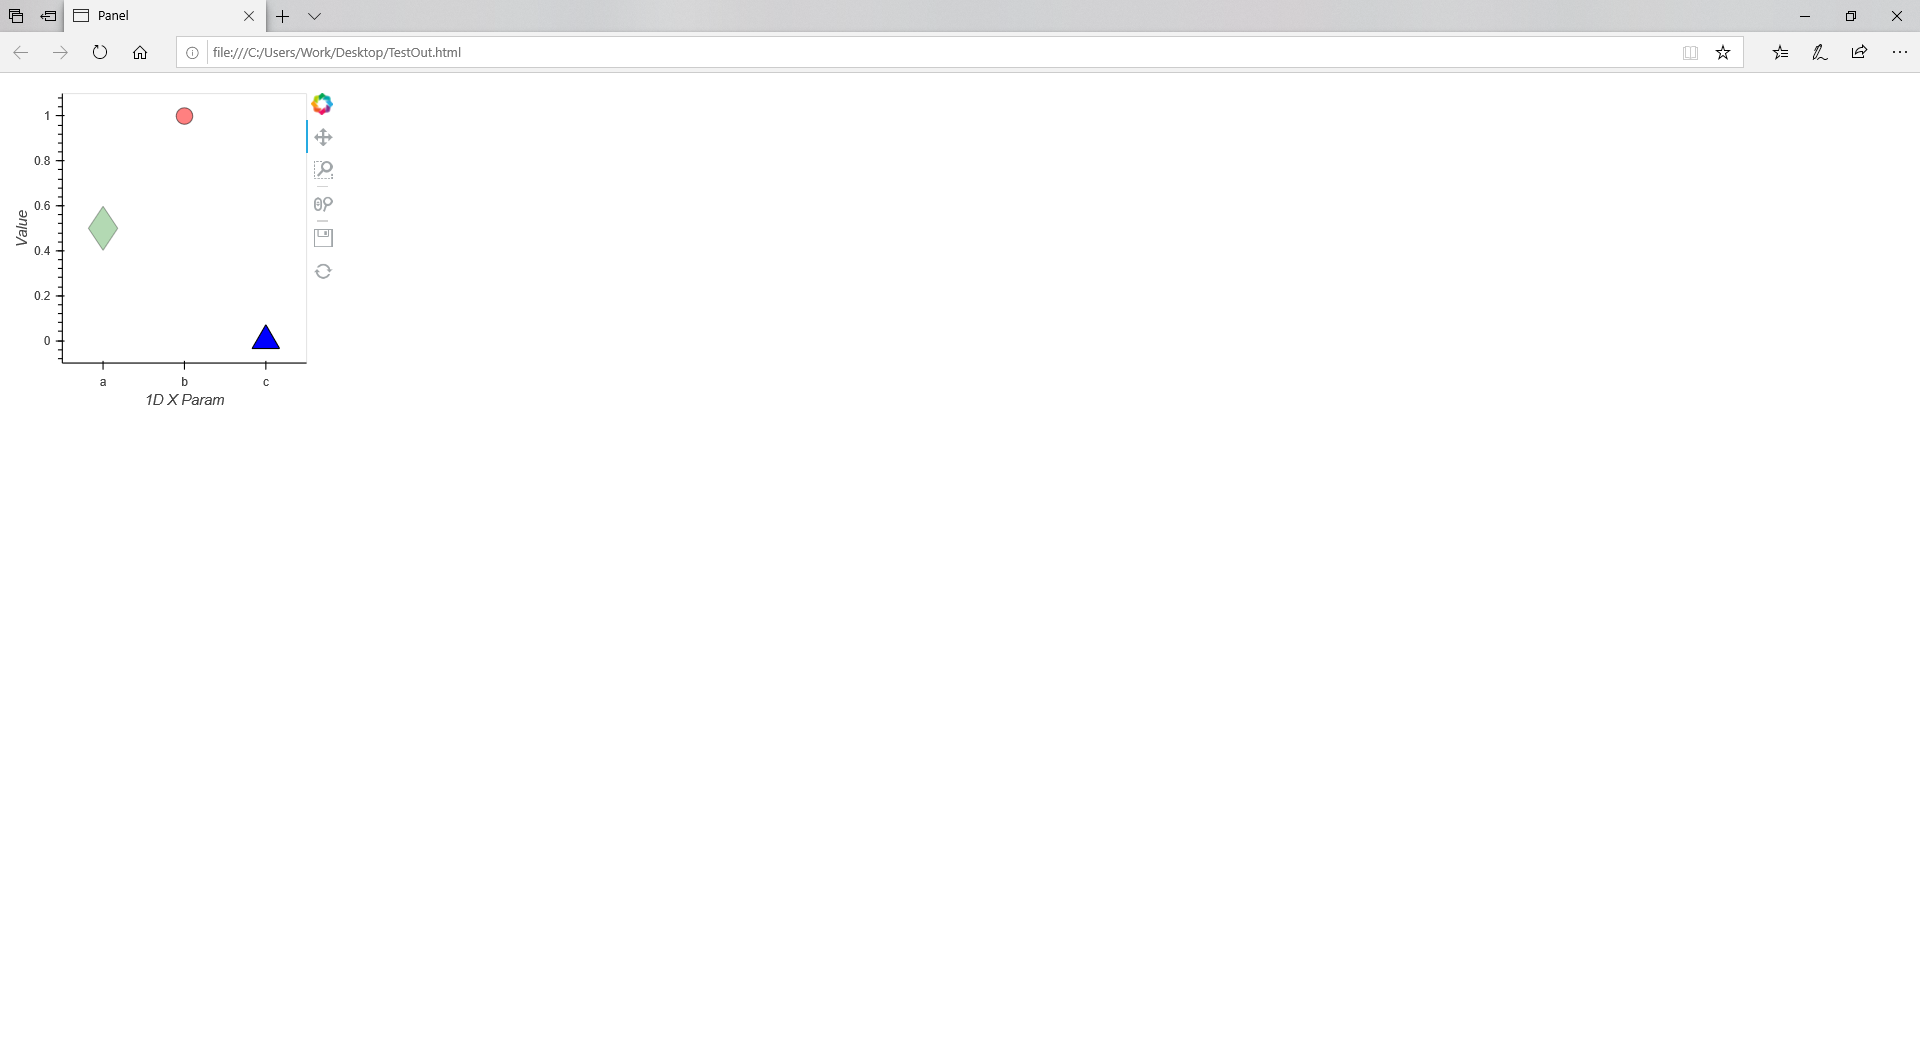
When using a point plot using dictionary and the X axis is defined by discrete strings, is there a way to reorder the x axis according to desired order?
For example, the following code produces a plot where the x axis shows ‘b’,‘c’,‘a’:

import panel
import holoviews
from holoviews import opts
from bokeh.resources import INLINE


holoviews.extension('bokeh')
data = {
    'Param': ['b','c', 'a'],
    'Value': [1, 0, 0.5],
    'alpha': [0.5, 1, 0.3],
    'color': ['red', 'blue', 'green'],
    'marker': ['circle', 'triangle', 'diamond'],
    'size': [15, 25, 40]
}

opts.defaults(opts.Points(padding=0.1, size=8, line_color='black'))

Plot = holoviews.Points(data, kdims=['Param','Value'], vdims=['alpha', 'color', 'marker', 'size']).redim.values(x_dimension=['a','b','c']).opts(alpha='alpha', color='color', marker='marker', size='size')

Out=panel.panel(Plot)
Out.save('TestOut', resources=INLINE) 

Is it possible to reorder the axis to show ‘a’,‘b’,‘c’ ?

The question is similar to the bar x order question . However, points are different, so the question is repeated here with respect to points.

I don’t know if there’s a special way within Holoviews, but I usually put the data in a dataframe and then sort that dataframe in the order needed:

    df = pd.DataFrame(data)
    df = df.sort_values(by='Param')
    hv.Points(data=df, kdims=['Param', 'Value'])

The same should work for Bars.

If anyone knows a way using Holoviews itself, please let me know, I’d like to learn about alternative methods :slight_smile:

Thanks Sander,

This is actually a conceptual issue. The data frame may contain multiple appearances of the same x value that you may want to look at in different order. For example, if we are counting the number of appearances of a certain letter in multiple files. We later may want to order those in different ways:

  • in alphabetic order : number of appearances of ‘a’ ,‘b’ ,‘c’
  • by qwerty order: ‘q’,‘w’,‘e’ …
  • other orders

I do not wish to change the data - just the order I see the points.

I think I figured it out. There was an error in my original post, one should use the following code:


import panel
import holoviews
from holoviews import opts
from bokeh.resources import INLINE


holoviews.extension('bokeh')
data = {
    'Param': ['b','c', 'a'],
    'Value': [1, 0, 0.5],
    'alpha': [0.5, 1, 0.3],
    'color': ['red', 'blue', 'green'],
    'marker': ['circle', 'triangle', 'diamond'],
    'size': [15, 25, 40]
}

opts.defaults(opts.Points(padding=0.1, size=8, line_color='black'))

Plot = holoviews.Points(data, kdims=['Param','Value'], vdims=['alpha', 'color', 'marker', 'size']).redim.values(Param=['a','b','c']).opts(alpha='alpha', color='color', marker='marker', size='size')

Out=panel.panel(Plot)
Out.save('TestOut', resources=INLINE) 


Note the .redim.values(Param=[‘a’,‘b’,‘c’]) note that Param is the name of the changed dimension - and not x_dimension as I wrote before - the name of the x value parameter matters here.

Did not test it on bars, yet it should be the same.

1 Like

How do you do this if your parameter name is not a valid python variable name?

Here @rindis,

The example below uses a parameter name that cannot be a python variable since it starts with a number and has spaces.

import panel
import holoviews
from holoviews import opts
from bokeh.resources import INLINE


holoviews.extension('bokeh')
data = {
    '1D X Param': ['b','c', 'a'],
    'Value': [1, 0, 0.5],
    'alpha': [0.5, 1, 0.3],
    'color': ['red', 'blue', 'green'],
    'marker': ['circle', 'triangle', 'diamond'],
    'size': [15, 25, 40]
}

opts.defaults(opts.Points(padding=0.1, size=8, line_color='black'))

Plot = holoviews.Points(data, kdims=['1D X Param','Value'], vdims=['alpha', 'color', 'marker', 'size']).redim.values(**{'1D X Param':['a','b','c']}).opts(alpha='alpha', color='color', marker='marker', size='size')

Out=panel.panel(Plot)
Out.save('TestOut', resources=INLINE) 

The output looks like:

You can find the code for redim here . What is being passed is a dictionary to python keywords argument and we can use the ** operator to just send a dictionary.

Holoviews creators designed this well.

2 Likes

Hi @Jacob-Barhak,

The .redim.values works well for scatter and points, but if you have a curve then it will still draw lines from points in the original order. See the example below. Do you know what to do in this case?

import pandas as pd
import holoviews as hv
hv.extension('bokeh', logo=False)

# create sample dataframe
data = {
    'month': ['August', 'June', 'May', 'April', 'July'], 
    'value': [3, 5, 7, 9, 5],
}
df = pd.DataFrame(data=data)

hv.Curve(df).redim.values(
    month=['April', 'May', 'June', 'July', 'August']
) 

This is basically @rindis question here:
https://stackoverflow.com/questions/58849395/holoviews-reorder-x-axis-ticks

Result, which draws lines from August to June etc.

So @SandervandenOord,

This is a great example of why points and curves are not the same.
When you implicitly define a curve, you actually define connectivity between points in the order you define them - not only the points.

When you originally wrote ‘August’, ‘June’, ‘May’, ‘April’, ‘July’ , you actually mean that the point (‘April’,9) is connected to (‘July’,5) with a curve segment, so whenever you place those months on the x axis, those will be connected to each other.

So in case of a curve segment, you actually have to redefine connectivity and the easiest way to do it is probably as you suggested and rearrange the dataframe to reflect the correct connectivity order. This does not seem to be something that holoviews should support, although if the library does, I will be very surprised.

However, another approach is to declare the line segments. I saw some Segments pull request , yet it was within datashader. When you define each segment explicitly it should work. However, I did not try it.

I did try using the Path while defining the order or months as an order parameter, yet it did not work - the order in which the points are presented, is the order that the line/path will be created, not the x values. And this makes sense since you do want the ability in a Curve/Path to allow going in all directions in space rather than “scan” the image from one side to the other.

I am not sure you wish to change this functionality and in this specific case you are presenting with lines, the solution is changing the order in the data frame as you suggested.

Its a very appropriate question though.

1 Like