I am using the matplotlib backend to save the resulting plot to an html file. My data is an xarray Dataset with dimensions time and z (altitude). The time dimension is of type numpy.datetime64[ns]. The plot results in an x-axis looking like this:
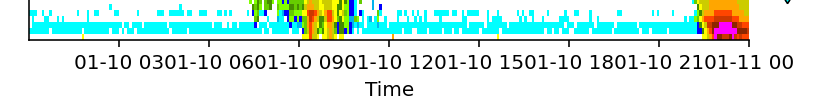
How can I change the format of the tick labels so that only the hour is showing? I found several examples using the bokeh backend but not much using the matplotlib backend.
I tried passing xformatter="%H" inside the plot call but I get the error: ValueError: unsupported format character 'H' (0x48) at index 1.
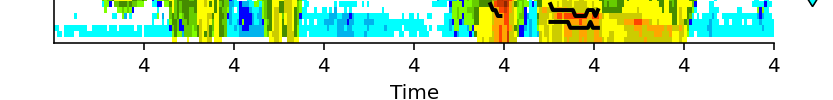
I also tried passing some convoluted transformation:
xformatter=mpl.ticker.FuncFormatter(lambda x, pos: f'{datetime.datetime.utcfromtimestamp(np.datetime64(int(x), "ns").astype("float")).hour}'),
which I think it is quite close, but the result is that all tick labels equal 4:
Any tips?