Here is a solution to this problem. First the complete code:
import holoviews as hv
import numpy as np
import panel as pn
import bokeh
from bokeh.resources import INLINE
from bokeh.models import HoverTool
from bokeh.models import CustomJSHover

pn.extension(safe_embed=True)
for library in [hv,pn,bokeh]:
    print ("%s version %s"% ( library, library.__version__))


hv.extension('bokeh')

frequencies = [0.5, 0.75, 1.0, 1.25]

MyCustomFreq = CustomJSHover(code='''
        var value;
        var modified;
        if (value>1) {
            modified = "High";
        } else {
            modified = value.toString();
        }
        return modified
''')

MyCustomPhase = CustomJSHover(code='''
        var value;
        var modified;
        modified = value / Math.PI;
        return modified.toString() + " * PI ";
''')

MyHover1 = HoverTool(
    tooltips=[
        ( 'xvals', '@xvals'),
        ( 'yvals', '@yvals'),
        ( 'phase', '@phase{custom}'),
        ( 'freq', '@freq{custom}'),
   ],
    formatters={
        'xvals' : 'numeral',
        'yvals' : 'numeral',
        '@phase' : MyCustomPhase,
        '@freq' : MyCustomFreq,
    },
    point_policy="follow_mouse"
)

def sine_curve(phase, freq):
    xvals = [0.1* i for i in range(100)]
    data = {
        'xvals' : xvals,
        'yvals' : [np.sin(phase+freq*x) for x in xvals],
        'phase' : [phase for x in xvals],
        'freq' : [freq for x in xvals],
    }
    plot =  hv.Points( data, kdims = ['xvals','yvals'], vdims = ['phase','freq'])
    return plot


phases      = [0, np.pi/2, np.pi, 3*np.pi/2]
curve_dict_2D = {(p,f):sine_curve(p,f) for p in phases for f in frequencies}
hmap = hv.HoloMap(curve_dict_2D, kdims=['phase', 'freq']).opts(tools = [MyHover1])

panel_Object = pn.pane.HoloViews(hmap)
panel_Object.save('SineHover.html', resources=INLINE, title = 'Hover Example', embed=True)

hv.save(hmap,'test_holoviews.html')
Here is how hovering looks like now:
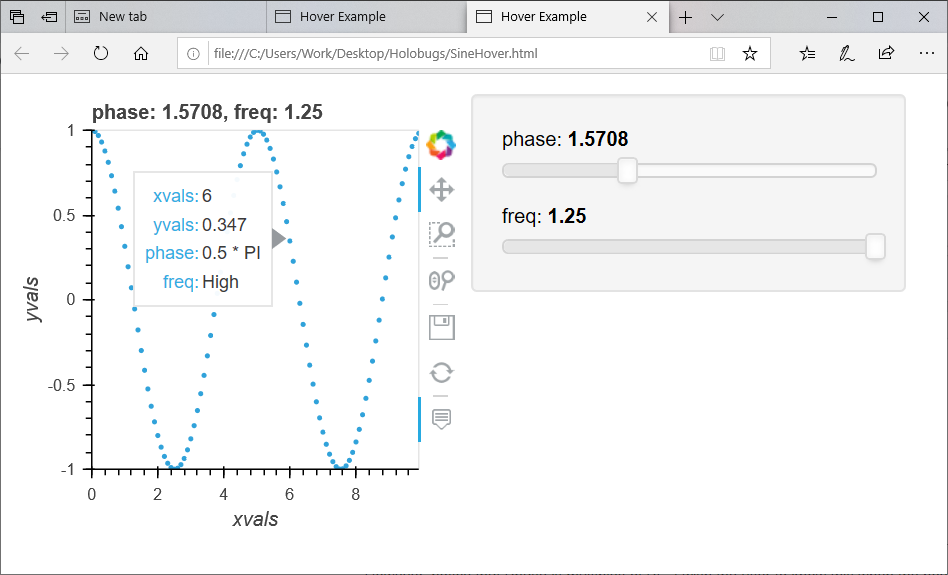
Notice that the Phase shows multiples of PI and for frequency higher than 1 Freq shows “High” otherwise it shows the frequency number.
Here are some instructions and tips to construct this properly:
-
In the hover tool definition a few changes are important:
- In the toot tip section it is important to point ot the correct formatter followed by
{custom}, e.g.'@freq{custom}' - The formatter name should match the variable name and now has
@before its name, e.g.'@freq' - The formatter now points to a custom python function the user creates, e.g.
@freq' : MyCustomFreq
- In the toot tip section it is important to point ot the correct formatter followed by
-
The custom function requires attention to the following:
- It has a
codeargument that receives a string that contains JavaScript code - not python - The JavaScript code should return a string
- Variables should be defined with
var, e.g. var value; - The variable
valueholds the point value provided by the python code. e.g.valueisfreqfor@freq. There are additional special names that can be found here under class CustomJSHover(**kwargs)
- It has a
-
In case of an error in definitions or in the JavaScript code, there may be no warning or error. Instead possible behaviors are:
- There will be no change and the user will see the numbers provided by freq or phase
- The hover tool may disappear
Using custom hover tool is very powerful and can allow some powerful capabilities as shown here, yet the basics above should be followed to use those properly.