Hover tools are very useful for interactive visualization. However, without customization, those may be limited to just visualizing the data series that built the plot. I wish to be able to add in the hover tool elements such as adding units of measure or converting units or conditional elements such as showing text that is conditional upon the value.
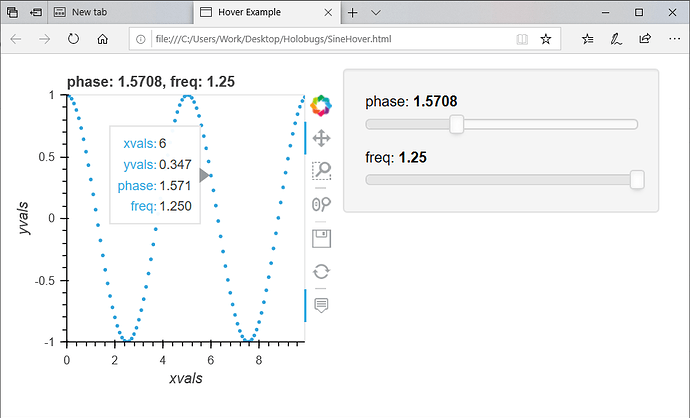
For example, the code below shows the simple example of a sine wave the user can control. I added a hover tool that shows the phase and frequency.
import holoviews as hv
import numpy as np
import panel as pn
import bokeh
from bokeh.resources import INLINE
from bokeh.models import HoverTool
from bokeh.models import CustomJSHover

pn.extension(safe_embed=True)
for library in [hv,pn,bokeh]:
    print ("%s version %s"% ( library, library.__version__))

hv.extension('bokeh')

frequencies = [0.5, 0.75, 1.0, 1.25]

MyHover1 = HoverTool(
    tooltips=[
        ( 'xvals', '@xvals'),
        ( 'yvals', '@yvals'),
        ( 'phase', '@phase'),
        ( 'freq', '@freq'),
   ],
    formatters={
        'xvals' : 'numeral',
        'yvals' : 'numeral',
        'phase' : 'numeral',
        'freq' : 'numeral',
    },
    point_policy="follow_mouse"
)


def sine_curve(phase, freq):
    xvals = [0.1* i for i in range(100)]
    data = {
        'xvals' : xvals,
        'yvals' : [np.sin(phase+freq*x) for x in xvals],
        'phase' : [phase for x in xvals],
        'freq' : [freq for x in xvals],
    }
    plot =  hv.Points( data, kdims = ['xvals','yvals'], vdims = ['phase','freq'])
    return plot

phases      = [0, np.pi/2, np.pi, 3*np.pi/2]
curve_dict_2D = {(p,f):sine_curve(p,f) for p in phases for f in frequencies}
hmap = hv.HoloMap(curve_dict_2D, kdims=['phase', 'freq']).opts(tools = [MyHover1])

panel_Object = pn.pane.HoloViews(hmap)
panel_Object.save('SineHover.html', resources=INLINE, title = 'Hover Example', embed=True)
Here is the resulting image when hovering:
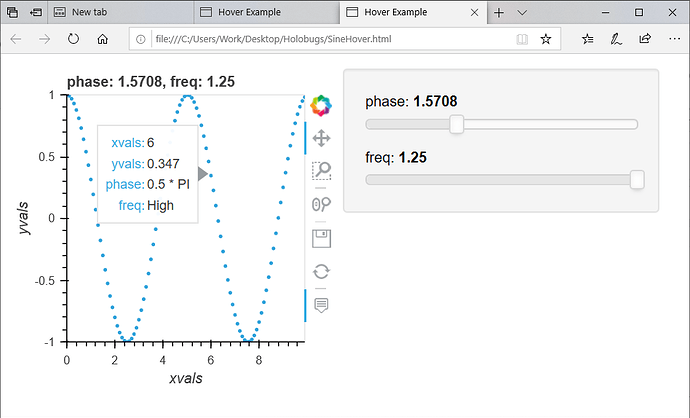
However, notice that Phase is multiples of PI - I wish the user to know this when the hovertool is used . Also for frequencies higher that 1, I wish the user to be notified with the text ‘High’ to indicate a high frequency rather than a number . The former corresponds for unit change and the latter is a conditional statement that is useful in many cases such as indicating infinity for very larger numbers.
There is some information on creating hover tools in those links 1 , 2 , 3 . However, I could not locate a complete example showing complex custom hover tool, and therefore I started this topic.

