I am able to process 5GB worth snappy compressed parquet local files and visualize them using holoviews, datashader, panel and bokeh on my mac. However, each user query takes a few seconds or even minutes sometimes and the visualization appears at once after all processing. I was wondering if there is any native support to progressively update the visualization from a dask dataframe as and when parts of the result are available.
import param, panel as pn
import dask.dataframe as dd
import holoviews as hv

class DataExplorer(param.Parameterized):
    xaxis_filter = param.Range(...)

    def load_data(self):
        return dd.read_parquet("*.parquet")

    def process_data(self, df):
        # Expensive compuation on a dask dataframe for example,
        return df[df.xaxis.between(*self.xaxis_filter)]

    @param.depends('xaxis_filter')
    def make_view(self):
        plot_df = self.process_data(self.load_data())
        points = hv.Points(plot_df) # too slow and pub-sub behaviour might help
        scatter = (dynspread(datashade(points))
        tooltip = rasterize(points, streams=[RangeXY]).apply(hv.QuadMesh)
        return (scatter * tooltip).opts(opts.QuadMesh(tools=['hover'], alpha=0, hover_alpha=0.2))

explorer = DataExplorer(name="")
dashboard = pn.Column(explorer.param, explorer.make_view)
I tried streaming visualizations but the size of Buffer started growing drastically making the implementation unusable on my mac. Any ideas or help is appreciated.
Thank you.
1 Like
In the original dask implementation, without any progressive visualization, the memory consumption was always way below the limits during computation and comes back to original after the plot is generated. It gives me hope that, this task is achievable on my mac with the above approach 
Just do no know how to implement it with cool libraries like streamz and holoviews natively 
This is a great question which has been asked a few times. I’ll try to play around with some approaches to get this working. One quick comment for now:
    @param.depends('xaxis_filter')
    def make_view(self):
        plot_df = self.process_data(self.load_data())
        points = hv.Points(plot_df) # too slow and pub-sub behaviour might help
        scatter = (dynspread(datashade(points))
        tooltip = rasterize(points, streams=[RangeXY]).apply(hv.QuadMesh)
        return (scatter * tooltip).opts(opts.QuadMesh(tools=['hover'], alpha=0, hover_alpha=0.2))
You no longer need a QuadMesh to get a tooltip since bokeh has supported Image tooltips for quite a while now, so I’d just go with:
points = hv.Points(plot_df)
rasterized = rasterize(points)
return dynspread(shade(rasterized)) * rasterized.opts(tools=['hover'], alpha=0)
1 Like
Some more tips on how to structure this. If you have sufficient memory I’d suggest persisting the 5GBs into memory, alternatively I’d at least persist the filtered version to memory. Here is how I would write your app:
import param, panel as pn
import dask.dataframe as dd
import holoviews as hv

class DataExplorer(param.Parameterized):

    xaxis_filter = param.Range()

    def __init__(self, filename, **params)
        self.data = dd.read_parquet(filename).persist()
        super(DataExplorer, self).__init__(**params)
        x_range = self.data.xaxis.min(), self.data.xaxis.max()
        self.param.xaxis_filter.bounds = x_range
        self.xaxis_filter = x_range

    def view(self):
        points = hv.Points(self.data).apply.select(xaxis=self.param.xaxis_filter)
        rasterized = rasterize(points)
        return dynspread(shade(rasterized)) * rasterized.opts(alpha=0)

explorer = DataExplorer(name="")
dashboard = pn.Column(explorer.param, explorer.view())
This should be significantly more efficient 1) it persists the data into memory, and 2) it doesn’t have to load and select on the data twice. I’m not sure how familliar you are with dask but dask is lazy and as such as you had written it previously load_data did not actually load any data and process_data did not actually process any data. Therefore when it came to rendering it would have to load the data and then apply the selection twice on initialization (once for the rasterized plot and once for the datashaded plot). And then every time you zoomed on the plot it would again load all 5 GB into memory. This is probably why it took minutes to render.
2 Likes
Thanks for the tips. Without hv.QuadMesh how to create hover info as shown in Working with large data using datashader — HoloViews v1.18.1
And what do you mean by # too slow and pub-sub behaviour might help?
Thanks for the tips. Without hv.QuadMesh how to create hover info as shown in Working with large data using datashader — HoloViews v1.18.1
Not entirely sure what you mean, adding .opts(tools=[‘hover’], alpha=0) will give you a hover tool.
That was a comment in your code, not mine.
This is what I was trying to achieve 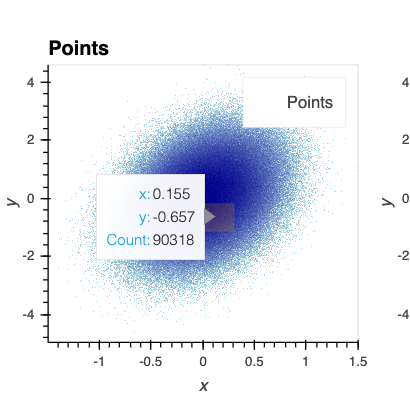
But without hv.QuadMesh, and only .opts(tools=[‘hover’], alpha=0), a minute box (may be per pixel) is shown. The tooltip shows the count of this minute box, where most are zero in my case.
Oh , added that pub-sub comment in the original question for explanation purposes and forgot about it. I was thinking of streamz when writing this. But couldn’t figure out the right implementation with Dask
I see, in that case do go back to using a QuadMesh:
scatter = dynspread(datashade(points))
tooltip = rasterize(points, streams=[RangeXY]).apply(hv.QuadMesh)
return (scatter * tooltip).opts(opts.QuadMesh(tools=['hover'], alpha=0, hover_alpha=0.2))
1 Like
Thanks a lot for this idea as well. I was relying on dask’s experimental cache() functionality but didn’t realize that we load the data 2nd time - again for hover info. It is a lot faster now and smartly uses memory once I added persist() in an instance method.
Tried a few more things for my original question - streaming progressive visualization but got some weird undeclared variable use errors from streamz. Shared the toy code via Colab here. Google colab seems to have problems with running distributed Dask workloads. The notebook runs fine on local machine if you are interested to run it.
Any more suggestions @philippjfr ?
What am I missing in this way to solve this problem?