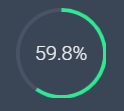
Is it possible to create something like below with the holoviz libraries?

I don’t think so. I would really like something like this as well.
There is a Feature Request here https://github.com/holoviz/holoviews/issues/4363. I’ve added your request there.
Feel free to like it to get it higher on the priority list.
But you can use Plotly in Panel and Plotly provides these things here https://plotly.com/python/indicator/
And if you don’t mind using panel.pane.HTML you can use html and css to create it. See https://codepen.io/vineethtrv/pen/xGjQOX
Thanks again for your insightful solutions!
If you get something working and can share a screenshot and/ or code, then please share. Would be awesome to see. Thanks.
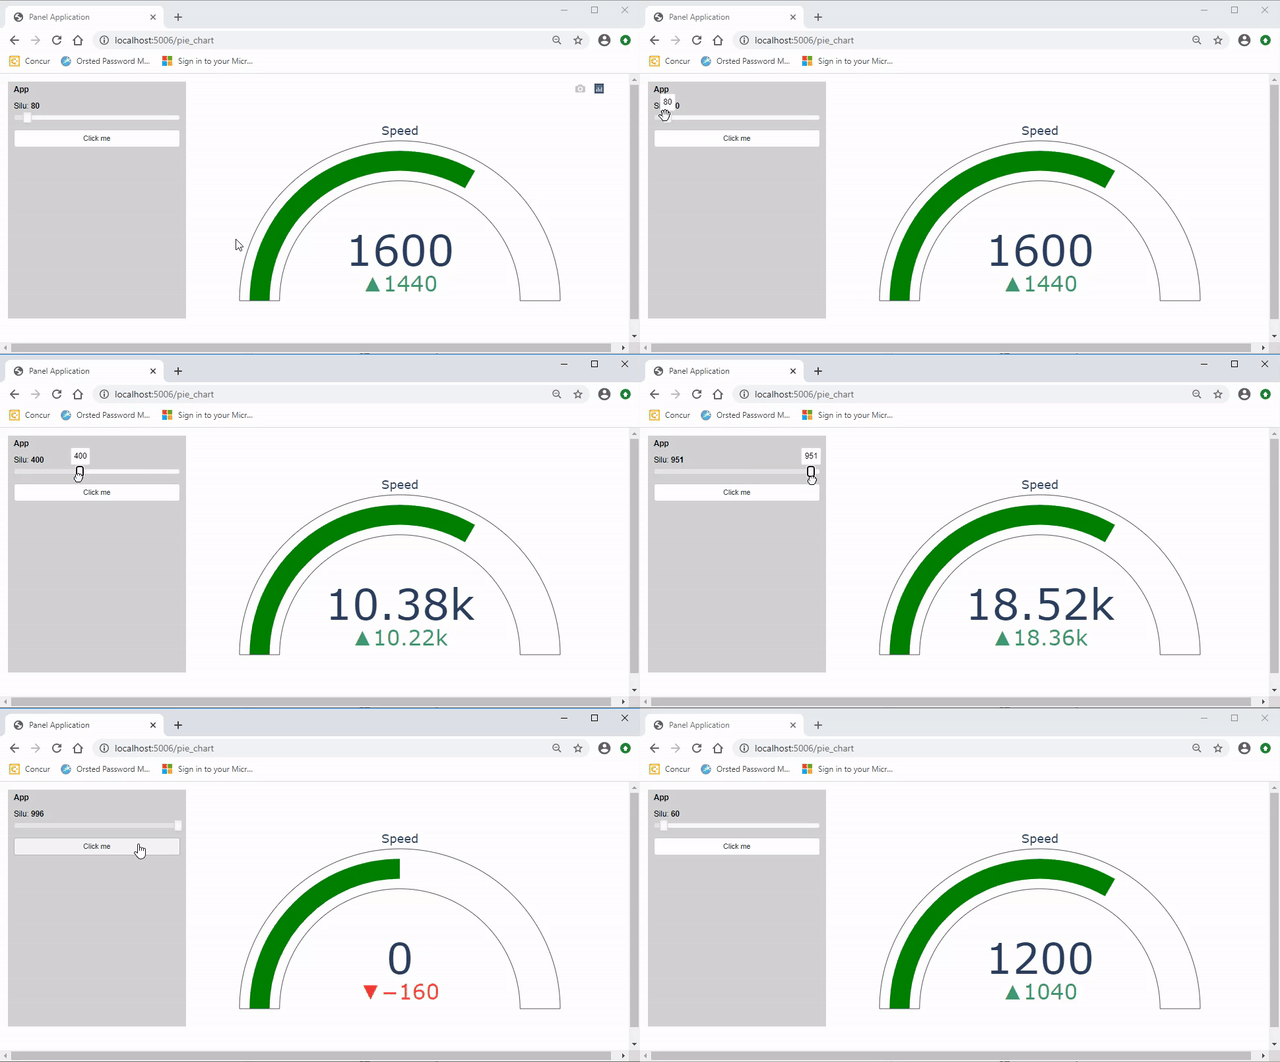
Hello !!! I tried to use a plotly indicator to indicate some properties in my panel. I update the plotly figure with pn.depends but the new figure overlaps with the old figure. You can see the gif
I do similar things with matplotlib figure and the old figure disappears with the same approach. The MRE is the next one:
import time
import panel as pn
pn.extension("plotly")

import plotly.graph_objects as go

fig = go.Figure()

slider = pn.widgets.IntSlider(name='silu', start =0, end = 1000, value = 0, width = 200)

@pn.depends(slider.param.value)
def fip(e):
    fig.add_trace(go.Indicator(
                    value = 20*slider.value,
                    delta = {'reference': 160},
                    gauge = { 'axis': {'visible': False} },
                    domain = {'row': 0, 'column': 0}
                            )
                )

    fig.update_layout(
    grid = {'rows': 1, 'columns': 1, 'pattern': "independent"},
    template = {'data' : {'indicator': [{
        'title': {'text': "Speed"},
        'mode' : "number+delta+gauge",
        'delta' : {'reference': 90}}]
                         }})
    return fig

def b(e):
    for i  in range (10):
        slider.value += 10
        print ('value changed')
        time.sleep(1)


btn = pn.widgets.Button(name = 'button', width =200)

btn.on_click(b)

pn.Row(pn.Column(btn, slider), fip).show()
I tried to run this code with .show in the notebook and bith bokeh serve in the terminal, but the behaviour is the same.
Thanks for the help,
N
Hi @nghenzi
You are almost there. The problem is that you append more and more traces. You need to clear the data of the figure each time you run fip: fig.data = []
import time
import panel as pn
pn.extension("plotly")

import plotly.graph_objects as go

fig = go.Figure()

slider = pn.widgets.IntSlider(name='silu', start =0, end = 1000, value = 0, width = 200)

@pn.depends(slider.param.value)
def fip(e):
    fig.data = []
    fig.add_trace(go.Indicator(
                    value = 20*slider.value,
                    delta = {'reference': 160},
                    gauge = { 'axis': {'visible': False} },
                    domain = {'row': 0, 'column': 0}
                            )
                )

    fig.update_layout(
    grid = {'rows': 1, 'columns': 1, 'pattern': "independent"},
    template = {'data' : {'indicator': [{
        'title': {'text': "Speed"},
        'mode' : "number+delta+gauge",
        'delta' : {'reference': 90}}]
                         }})
    return fig

def b(e):
    for i  in range (10):
        slider.value += 10
        print ('value changed')
        time.sleep(1)


btn = pn.widgets.Button(name = 'button', width =200)

btn.on_click(b)

pn.Row(pn.Column(btn, slider), fip).show(port=5007)
Thank you very much for the quick response @Marc !!!
I noticed a glitch when the semi-pie chart updates. Its because you put fip in as a function. It’s “slow” as it needs to determine the type of object and transfer a Plotly pane to the browser for each update. If you define a Plotly pane instead and just update the .object it works better.
I’ve created a parametrized example below. I just love the Parameterized api 
I tried to optimize for efficiency as described here https://panel.holoviz.org/reference/panes/Plotly.html but it is not totally clear to me if I did the “perfect” thing.
import time
import panel as pn
import param

pn.extension("plotly")

import plotly.graph_objects as go


class App(param.Parameterized):
    silu = param.Integer(default=0, bounds=(0, 1000))
    click_me = param.Action()
    view = param.Parameter()

    def __init__(self, **params):
        super().__init__(**params)

        self.settings_pane = pn.Param(
            self,
            parameters=["silu", "click_me"],
            sizing_mode="fixed",
            height=400,
            width=300,
            background="lightgrey",
        )
        self.fig = self._get_figure()
        self.figure_pane = pn.pane.Plotly(self.fig, sizing_mode="stretch_width")
        self.view = pn.Column(
            pn.Row(self.settings_pane, self.figure_pane, sizing_mode="stretch_both"),
            sizing_mode="stretch_both",
        )

        self.click_me = self._click_me
        self._update_figure()

    def _get_figure(self):
        fig = go.Figure()
        fig.update_layout(
            grid={"rows": 1, "columns": 1, "pattern": "independent"},
            template={
                "data": {
                    "indicator": [
                        {
                            "title": {"text": "Speed"},
                            "mode": "number+delta+gauge",
                            "delta": {"reference": 90},
                        }
                    ]
                }
            },
        )
        return fig

    @param.depends("silu", watch=True)
    def _update_figure(self):
        self.fig.data=[]
        self.fig.add_trace(
            go.Indicator(
                value=20 * self.silu,
                delta={"reference": 160},
                gauge={"axis": {"visible": False}},
                domain={"row": 0, "column": 0},
            )
        )
        self.figure_pane.object = self.fig.to_dict()

    def _click_me(self, events):
        for i in range(10):
            if self.silu + 10 < 1000:
                self.silu += 10
            else:
                self.silu = 0
            print("value changed")
            time.sleep(0.33)


App().view.servable()

Thank you very much again !!! I noticed the glitch several times in many scripts and I thought it was normal. With your explanation and the object replacement suggestion I could solve the glicth in a lot of differents scripts.
Thank for the explanation and awesome-panel !!!
I continue exploring gauges, Now I embedded the echarts library in a HTML pane to obtain another gauge.
import time
import panel as pn
import param

pn.extension("plotly")

import plotly.graph_objects as go

pn.config.js_files["echart1"] = "https://cdn.bootcss.com/echarts/3.7.2/echarts.min.js"

pn.config.sizing_mode = "stretch_width"


STYLE = """
body {
margin: 0px;
min_height: 100vh;
}
.bk.app-bar {
background: #212121;
border-color: white;
box-shadow: 5px 5px 20px #9E9E9E;
color: #ffffff;
z-index: 50;
}

"""


pn.config.raw_css.append(STYLE)

top_bar = pn.Row(pn.pane.Markdown("# Classic Dashboard in Panel ", margin=(10, 5, 10, 25)),
                        pn.Spacer(height=0),
                        pn.pane.PNG(
                            "https://panel.holoviz.org/_static/logo_horizontal.png",
                            width=200,
                            sizing_mode="fixed",
                            align="center",
                            margin=(10, 50, 10, 5),
                        ),
                        css_classes=["app-bar"],
                    )


### slider to control the value of the gauges  ###

int_slider = pn.widgets.IntSlider(name='Integer Slider', start=0, end=100, step=1, value=4, width=200)


# initialization of plotly pane

fig = go.Figure()
fig.add_trace(go.Indicator(
                value = 2,
                delta = {'reference': 1},
                gauge = { 'axis': {'visible': False} },
                domain = {'row': 0, 'column': 0}
                        )
            )
fig.update_layout(
grid = {'rows': 1, 'columns': 1, 'pattern': "independent"},
template = {'data' : {'indicator': [{
    'title': {'text': "Speed"},
    'mode' : "number+delta+gauge",
    'delta' : {'reference': 45}}]
                     }})
plotly_pane = pn.pane.Plotly(fig)


### initialization of echarts gauge ###

html = """
<div id="855be12876564e2fb3fd5fe122d3d221" class="chart-container" style="width:500px; height:300px;"></div>
"""

script = """
<script>
var myScript = document.currentScript;
var myDiv = myScript.parentElement.firstElementChild;
var myChart = echarts.init(myDiv);
myDiv.eChart = myChart;

var option = {
tooltip: {
    formatter: '{a} <br/>{b} : {c}%'
},
toolbox: {
    feature: {
        restore: {},
        saveAsImage: {}
    }
},
series: [
    {
        name: 'Echarts velocimeter',
        type: 'gauge',
        detail: {formatter: '{value}%'},
        data: [{value: 50, name: 'vel'}]
    }
]
};

option.series[0].data[0].value = 25;
myChart.setOption(option, true);

myDiv.after_layout = myChart.resize; // Resizes the chart after layout of parent element

</script>

"""

ech = pn.pane.HTML(html+script, margin=15)


### Here I create a dummy HTML pane to send commands to update the echarts gauge ###
ech_dummy = pn.pane.HTML("")


@pn.depends(int_slider.param.value, watch=True)
def update_gauges(e):
# update plotly pane
    fig.data = []
    fig.add_trace(go.Indicator(
                value = int_slider.value ,
                delta = {'reference': 2},
                gauge = { 'axis': {'visible': False} },
                domain = {'row': 0, 'column': 0}
                        )
            )
    fig.update_layout(
    grid = {'rows': 1, 'columns': 1, 'pattern': "independent"},
    template = {'data' : {'indicator': [{
    'title': {'text': "Speed"},
    'mode' : "number+delta+gauge",
    'delta' : {'reference': 45}}]
                     }})

    plotly_pane.object = fig.to_dict()

# update echarts HTML pane
    part1 = " <script> option.series[0].data[0].value = "
    part3 = " ; myChart.setOption(option, true); </script> "
    ech_dummy.object = part1 + str(int_slider.value) + part3


pn.Column(top_bar,
      pn.Row(int_slider,
             plotly_pane,
             ech),
      ech_dummy).show()
Here you have a screenshot of the gauges working
Thank you very much to the panel developers,
it’s an amazing library to present my scientific results !!!
Hello !
This is my last post about gauges, now I have what I was looking for. In this case I have three horizontal indicators in a plotly figure.
import panel as pn
pn.extension("plotly")
import plotly.graph_objs as go


# function to add plotly indicator to the figure
def add_plotly_trace(fig, value, rango, step1,step2,step3, domain_x,domain_y, bar_color):
    fig.add_trace(go.Indicator(
                    value = value,
                    gauge = { 'shape': "bullet",
                              'axis' : {'visible': False, 'range': rango},
                              'bar':{'color': bar_color ,  'thickness': .75},
                              'threshold': {'line': { 'color': "white", 'width': 2}, # linea roja indicatina...
                               'thickness': 1.,
                               'value':120},
                        'steps': [ { 'range': step1, 'color': "lightgray" },
                                        { 'range': step2, 'color': "gray" },
                                        { 'range': step3, 'color': "red" }
                              ]
                        },
                    domain = {'x': domain_x, 'y': domain_y}
                    )
                )


# function to update layout defining properties
def update_plotly_layout(fig, nrows, ncols, title1,title2,title3):
    fig.update_layout(
        grid = {'rows': 3, 'columns': 1, 'pattern': "independent"},
        template = {'data' : {'indicator': [
            {'title': {'text': title1}, 'mode' : "number+delta+gauge", 'delta' : {'reference': 90} },
            {'title': {'text': title2}, 'mode' : "number+delta+gauge", 'delta' : {'reference': 90} },
            {'title': {'text': title3}, 'mode' : "number+delta+gauge", 'delta' : {'reference': 90} }  ]
                             }
                   }
        )


# init plotly figure
fig = go.Figure()
add_plotly_trace(fig, 10, [0,150],[0, 50],[50, 90],[90, 150],[0.05, 1],[0.15, 0.35], 'green')
add_plotly_trace(fig, 7.5, [0,150], [0, 50],[50, 90],[90, 150], [0.05, 1],[0.45, 0.65],'orange')
add_plotly_trace(fig, 5, [0,150], [0, 50],[50, 90],[90, 150], [0.05, 1],[0.75, 0.95], 'blue')
update_plotly_layout(fig, 3, 1, 'velocidad','speed','Npeaks')


slider = pn.widgets.IntSlider(name = 'Value indicators', value = 10, start = 0, end = 150)


@pn.depends(slider.param.value, watch = True)
def update_gauges(e):
    fig.data = []
    add_plotly_trace(fig, slider.value, [0,150],
                     [0, 50],[50, 90],[90, 150],
                     [0.05, 1],[0.15, 0.35], 'green')
    add_plotly_trace(fig, .5*slider.value, [0,150],
                     [0, 50],[50, 90],[90, 150],
                     [0.05, 1],[0.45, 0.65],'orange')
    add_plotly_trace(fig, .75*slider.value, [0,150],
                     [0, 50],[50, 90],[90, 150],
                     [0.05, 1],[0.75, 0.95], 'blue')
    update_plotly_layout(fig, 3, 1, 'velocidad','speed','Npeaks')
    pp.object = fig.to_dict()

pp = pn.pane.Plotly(fig)
pn.Column(slider, pp).show()
And here there is one screenshot of the indicators working


