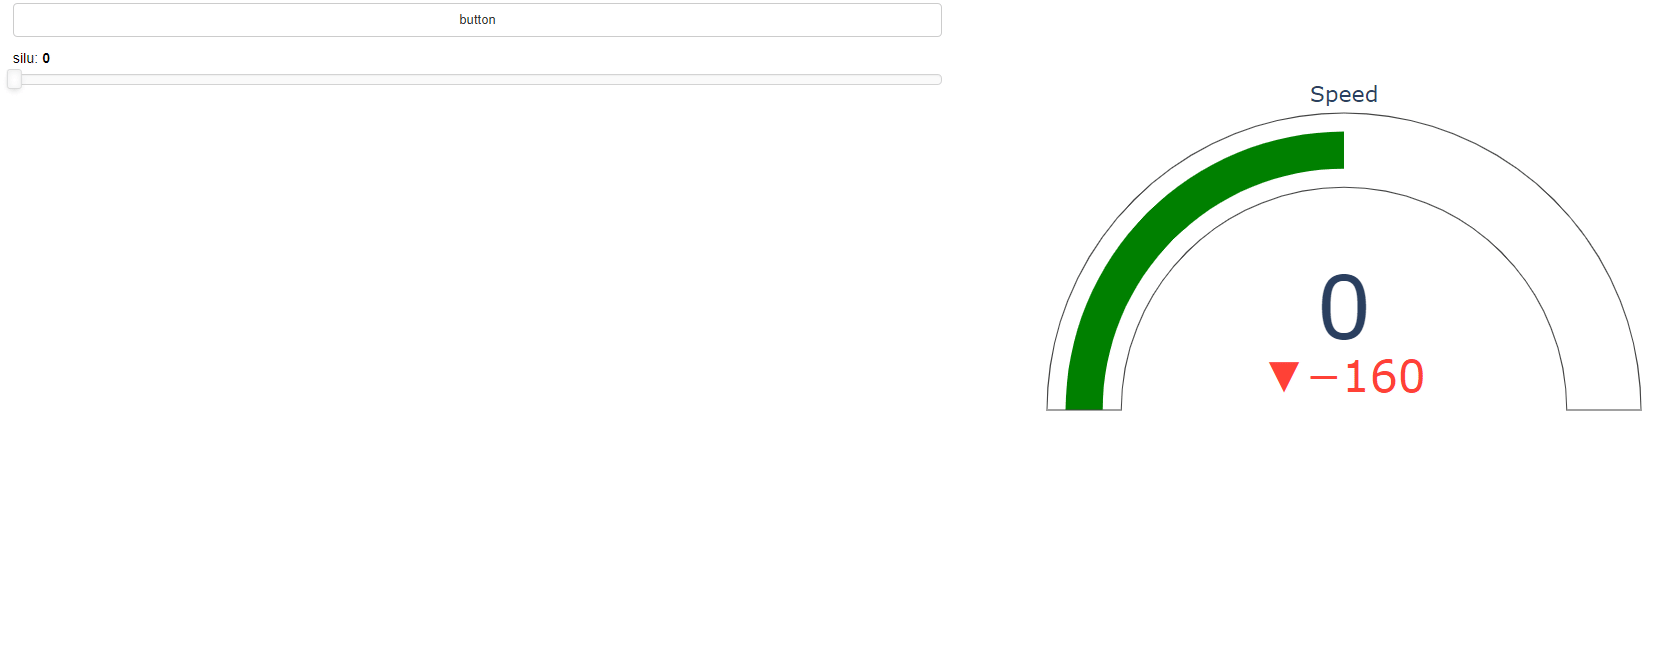
Hello !!! I tried to use a plotly indicator to indicate some properties in my panel. I update the plotly figure with pn.depends but the new figure overlaps with the old figure. You can see the gif
I do similar things with matplotlib figure and the old figure disappears with the same approach. The MRE is the next one:
import time
import panel as pn
pn.extension("plotly")

import plotly.graph_objects as go

fig = go.Figure()

slider = pn.widgets.IntSlider(name='silu', start =0, end = 1000, value = 0, width = 200)

@pn.depends(slider.param.value)
def fip(e):
    fig.add_trace(go.Indicator(
                    value = 20*slider.value,
                    delta = {'reference': 160},
                    gauge = { 'axis': {'visible': False} },
                    domain = {'row': 0, 'column': 0}
                            )
                )

    fig.update_layout(
    grid = {'rows': 1, 'columns': 1, 'pattern': "independent"},
    template = {'data' : {'indicator': [{
        'title': {'text': "Speed"},
        'mode' : "number+delta+gauge",
        'delta' : {'reference': 90}}]
                         }})
    return fig

def b(e):
    for i  in range (10):
        slider.value += 10
        print ('value changed')
        time.sleep(1)


btn = pn.widgets.Button(name = 'button', width =200)

btn.on_click(b)

pn.Row(pn.Column(btn, slider), fip).show()
I tried to run this code with .show in the notebook and bith bokeh serve in the terminal, but the behaviour is the same.
Thanks for the help,
N