how to create a subplots with Boxplots

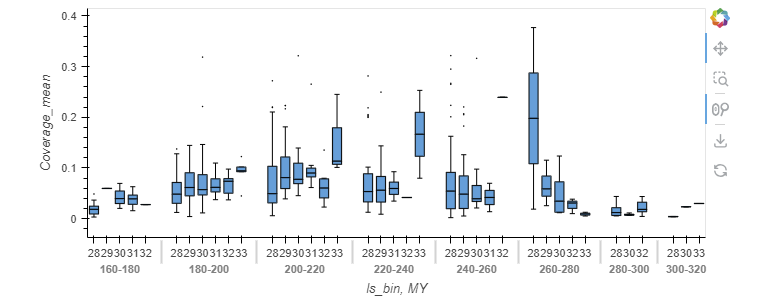
So i want to do multiple Subplots of an Boxplot where the data has about 6 different values of MY. But when i do it as follows:

DataMerge.hvplot.box(y="Coverage_mean",by=["ls_bin","MY"], subplots=True)

I only obtain the following plot


I am sorry for not being able to provide the Data file as I am not able to share it. I hope someone might now a way to approach this problem regardless.

Kind regards
Tom
You could probably loop through and store in hv.Layout()

1 Like

would you be so kind as to point me towards the API description of hv.layout(), I can to this day not navigate the docs very well.

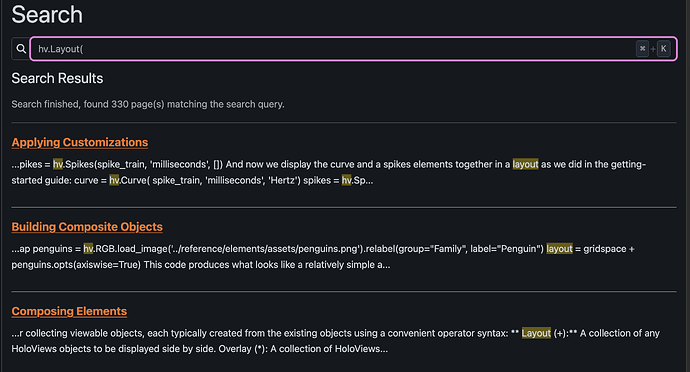
I found this through searching hv.Layout( and trying a few links:

https://holoviews.org/user_guide/Composing_Elements.html#building-a-layout-from-a-list

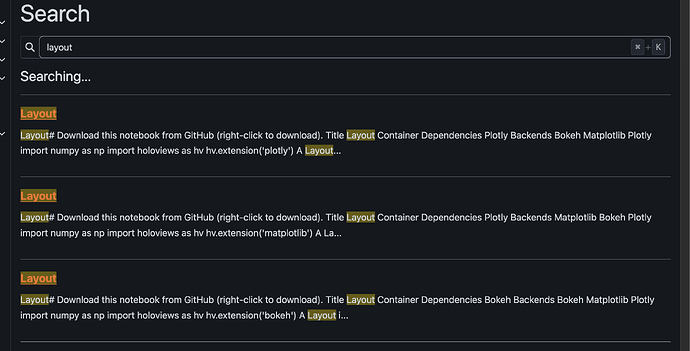
But I can see why it’s confusing for layout

https://holoviews.org/search.html?q=layout#