Hi everyone!
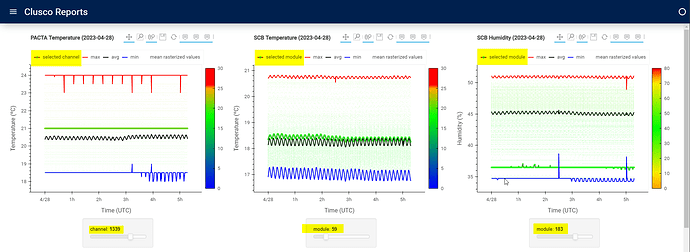
Anyone knows if there is any way to display the selected value in the widget - when using the groupby option - while plotting with hvplot? I would like it to appear in the legend label. Maybe there is a way to do it just assigning it in the label parameter
I have seen that by default, if no custom title is given to the graph, the title is updated according to the value selected in the widget. I wanted to achieve the same thing but in the legend label.
def hvplot_df_line(df, x, y, title, dic_opts, groupby, color):
    dynamic_map = df.hvplot.line(x=x, y=y, title=title, color=color, groupby=groupby, label='selected ' + groupby,  responsive=True, min_height=400, muted_alpha=0)
    options = list(dic_opts.items())
    dynamic_map.opts(**dict(options))

    return dynamic_map
