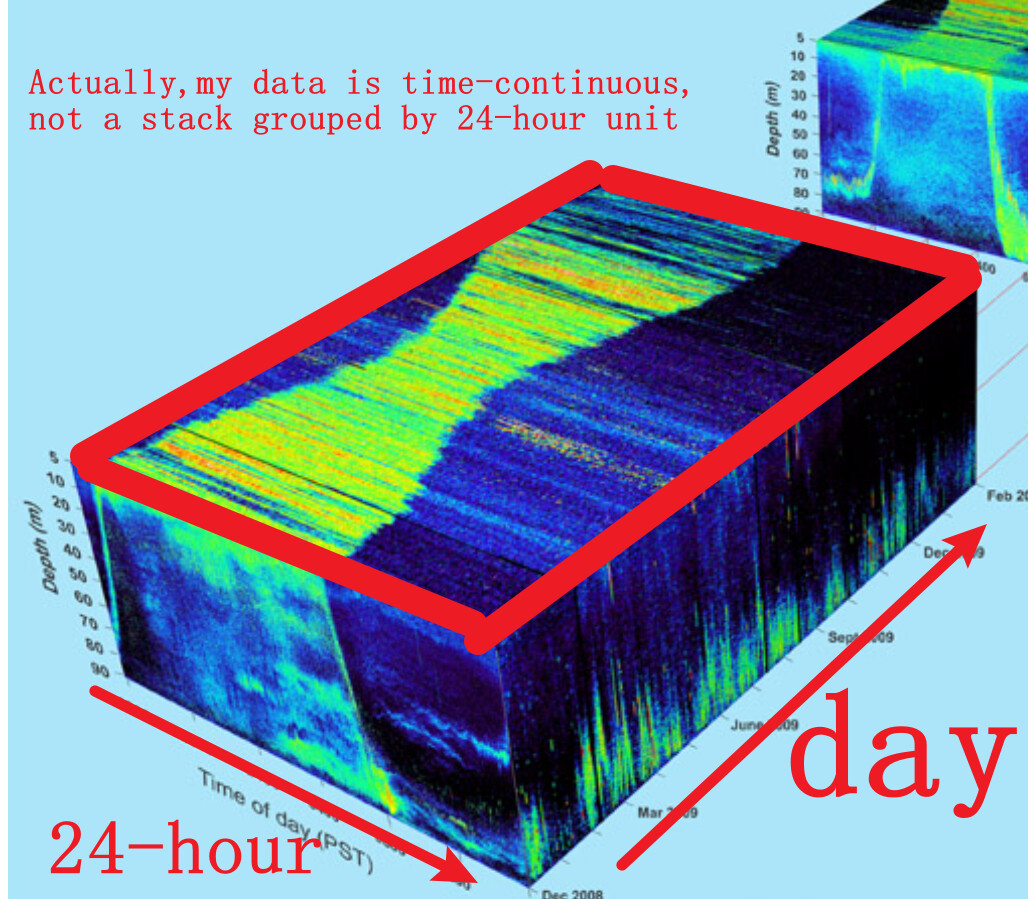
Hi! ![]() I wanna ask how to draw cross section by using image/heatmap, like the top/bottom face of the data cube(dimension: 24 hr x total number of days selected) below.
I wanna ask how to draw cross section by using image/heatmap, like the top/bottom face of the data cube(dimension: 24 hr x total number of days selected) below.
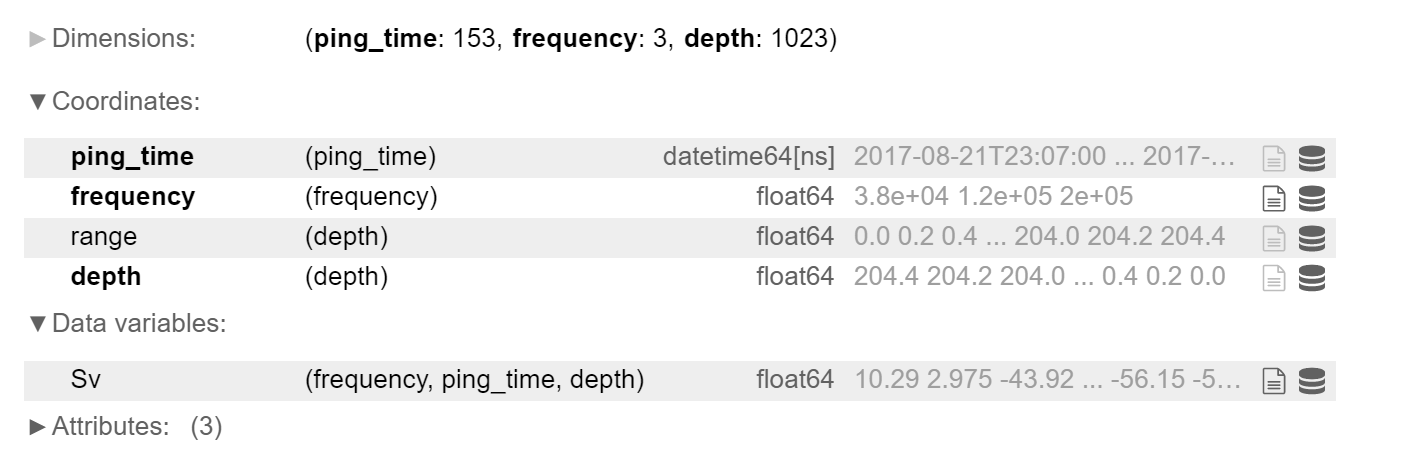
This is my data array.
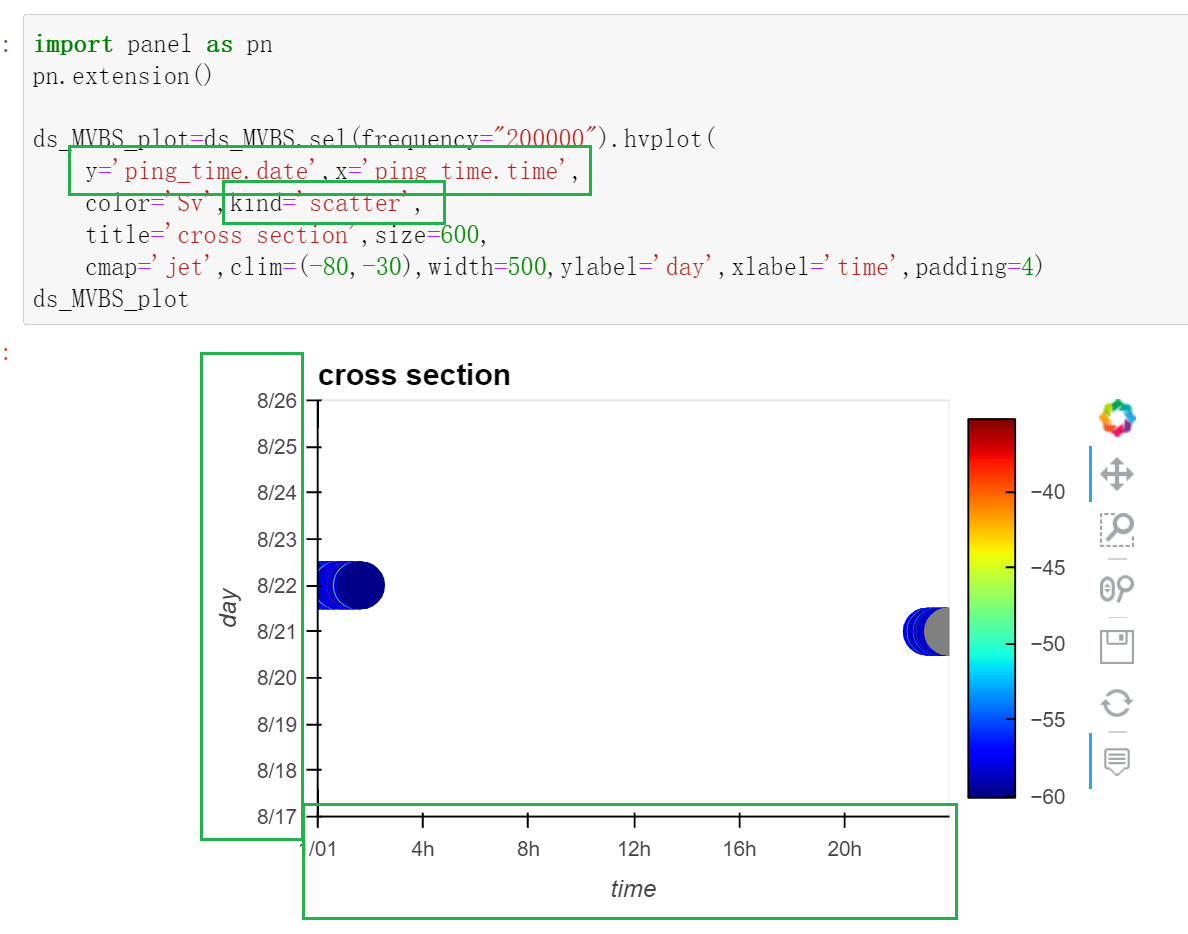
when using scatter, it can work to set y=‘ping_time.date’,x=‘ping_time.time’.
But when using heatmap, it shows nothing.
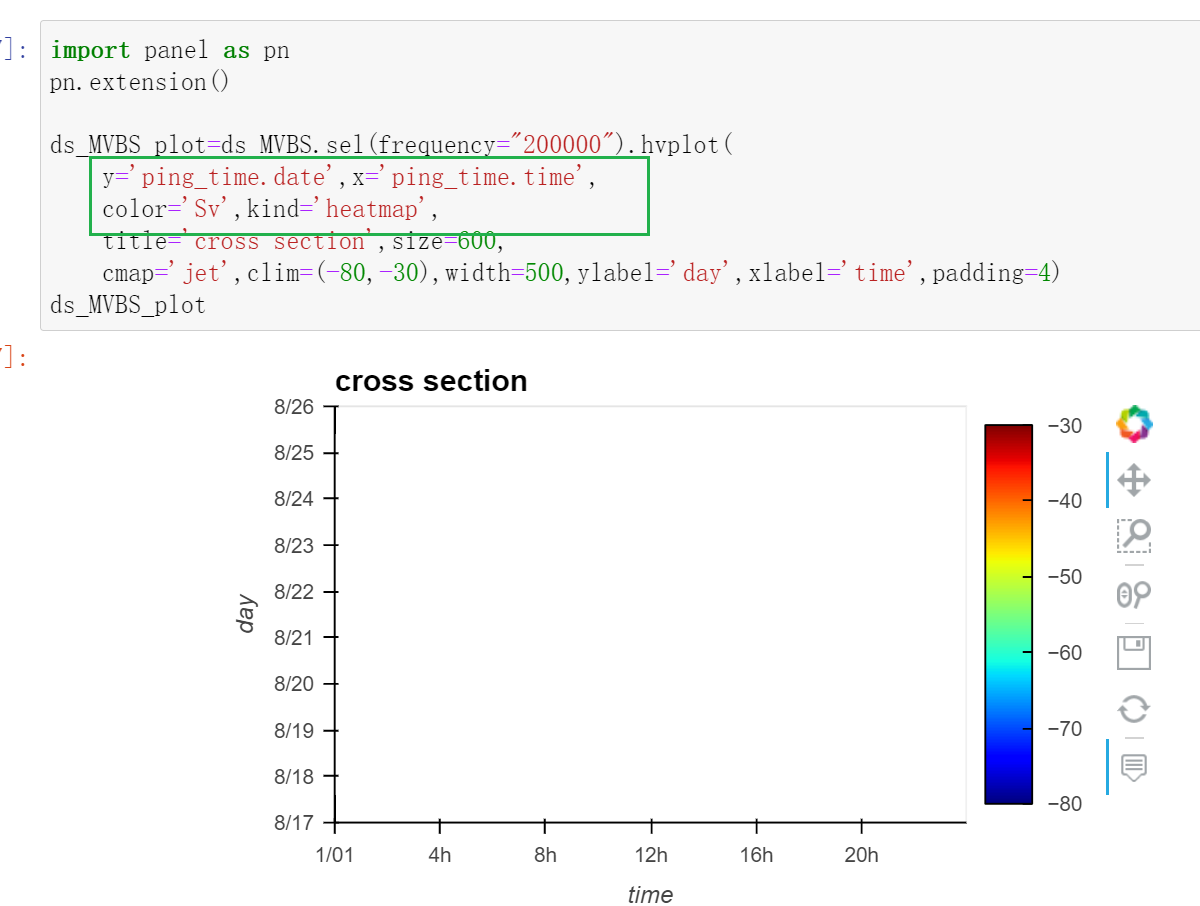
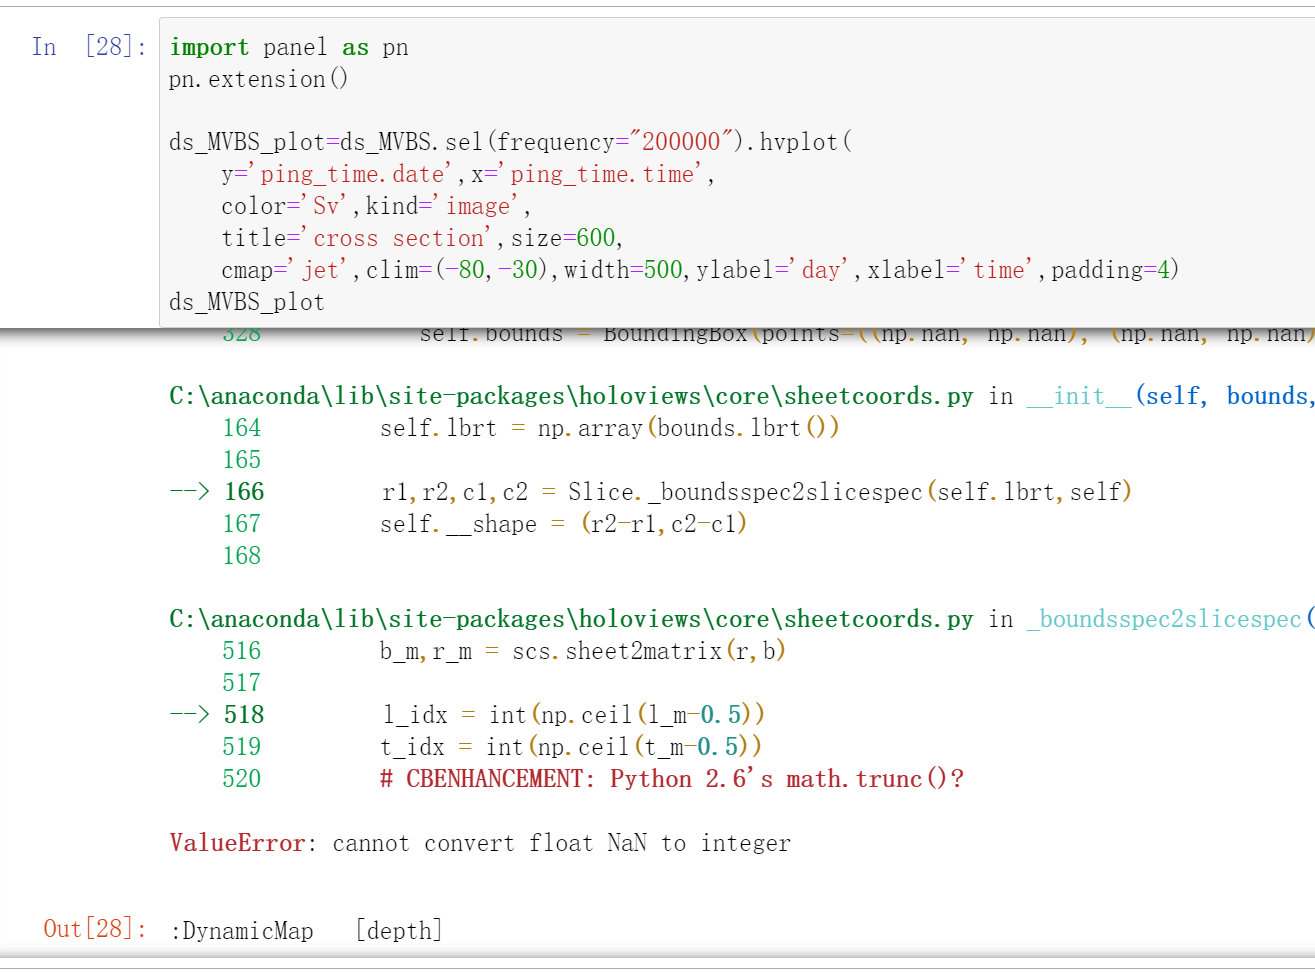
And when using image, it reports errors.