I am experiencing that minor grid lines are shown in Jupyter Notebook, but not in Panel Application.
Any suggestions on how to enable minor gridlines in Panel Application are highly appreciated, see example below (only tested with plotly backend).
System info:
Python 3.9.12 | packaged by conda-forge | (main, Mar 24 2022, 23:17:03) [MSC v.1929 64 bit (AMD64)] on win32
panel.__version__: '0.13.1'
plotly.__version__: '5.8.0'
bokeh.__version__: '2.4.3'
jupyter_core: 4.10.0
notebook: 6.4.8
conda 4.13.0
import panel as pn
import plotly.express as px
import pandas as pd
pn.extension('plotly', sizing_mode = 'fixed')
df = px.data.tips()
fig = px.scatter(df, x="total_bill", y="tip", color="sex")
fig.update_xaxes(minor=dict(showgrid=True))
fig.update_yaxes(minor=dict(showgrid=True))
fig.update_layout(width=800, height=550)
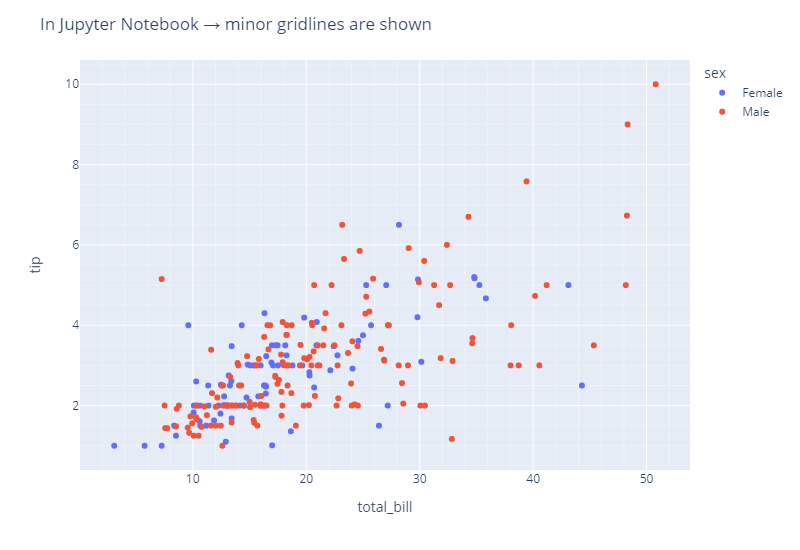
### Alt. 1 -> figure is shown as expected with minor gridlines in Jupyter Notebook
fig.update_layout(title='In Jupyter Notebook → minor gridlines are shown')
fig.show()
### Alt. 2 -> figure is not shown with minor gridlines
fig.update_layout(title='Panel Application → minor gridlines are missing')
pane = pn.panel(fig, sizing_mode='fixed')
pane.show()

Thanks,
Erlend