How to format float and other values in a line plot hover?
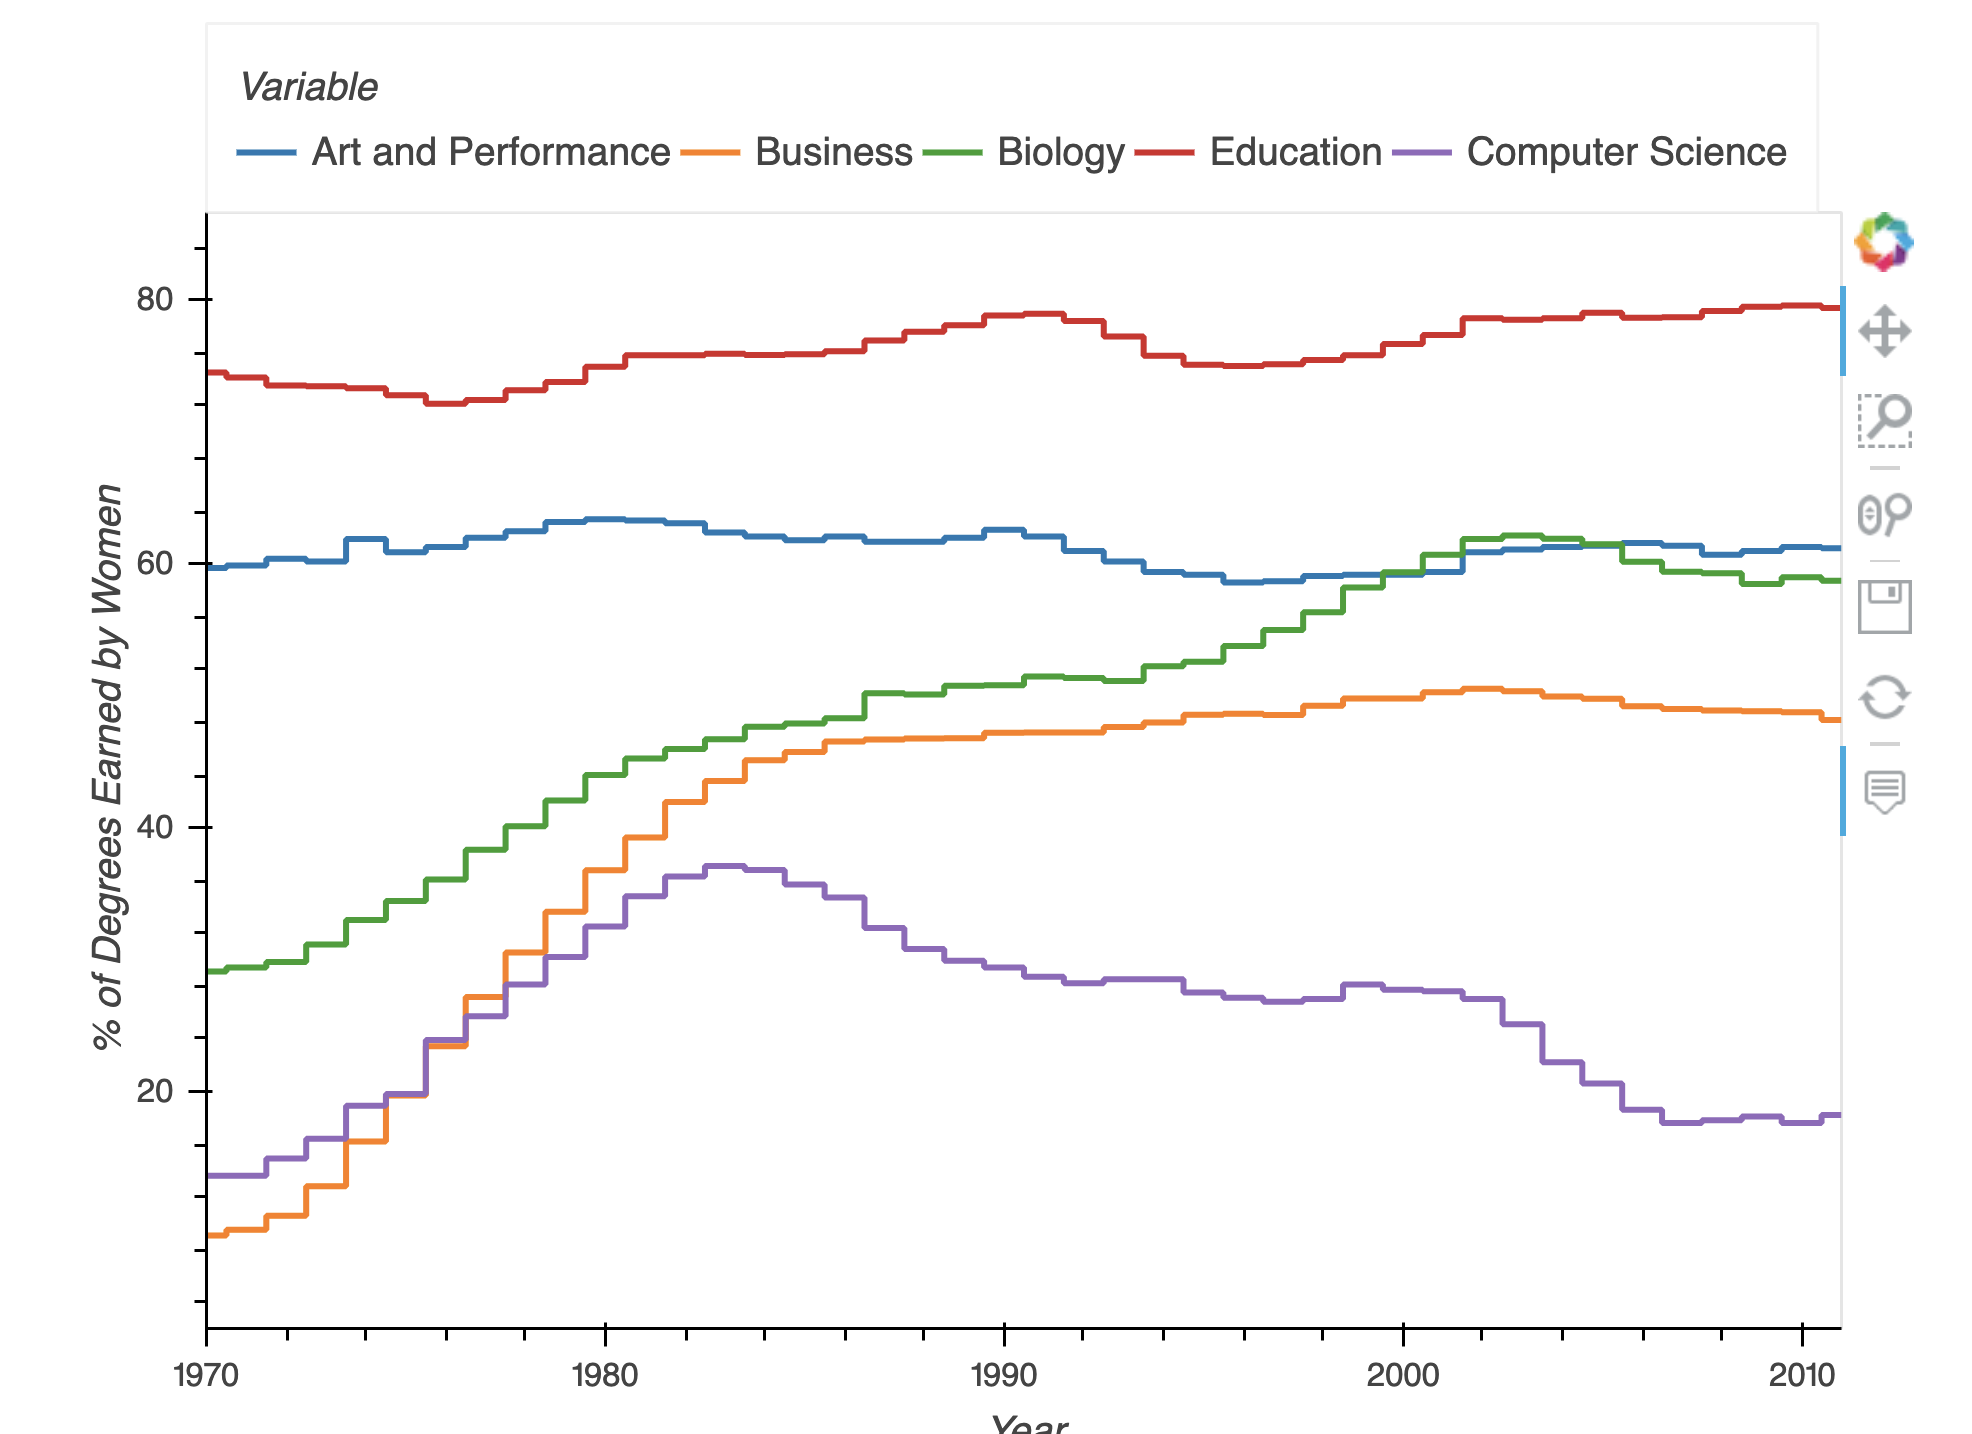
For example, in https://hvplot.holoviz.org/reference/pandas/step.html#pandas-gallery-step,
if you hover over the lines the year is shown in scientific notation. I would like to see an example of how these values can be formatted.
1 Like
One way to customize the hover display is to use bokeh’s hovertool:
from bokeh.models import HoverTool
# Syntax: $. are 'special fields':  $x inserts the x-coordinate
#         @. are fields from the color data source:
#            provide an extra column of values and declare it's name as a vdim (or sue a pd.DataFrame)

data  = pd.DataFrame( { 'x': [1.1, 3.2, 5.8 ], 'state': ['NY', 'NJ', 'PA'], 'stuff': ['a','b','c']} )
hover = HoverTool(tooltips=[("error", "$x"),
                            ("state", "@state"),
                            ("stuff", "@stuff")
                           ])
hv.Scatter( data, kdims='x', vdims=['state', 'stuff']).opts(plot=dict(tools=[hover]), style=dict(size=10)).redim.range(x=(0,7))
Just realized the opts syntax is a bit out of date…
1 Like
I am also interested by this question. How would you format the hoovertool object for the example shared by @agstreet ? (https://hvplot.holoviz.org/reference/pandas/step.html#pandas-gallery-step)
If you want the year to be at the format YYYY (a four digit integer)? or at the float format (YYYY.yy)?
you can use formatters with the Hovertool.
See https://docs.bokeh.org/en/latest/docs/user_guide/tools.html
the sectiion entitled Formatting Tooltip Fields
also see https://stackoverflow.com/questions/51496142/formatting-pandas-datetime-in-bokeh-hovertool
df  = pd.DataFrame( { 'x':         [1.1, 3.2, 5.8 ],
                      'state':     ['NY', 'NJ', 'PA'],
                      'stuff':     ['a','b','c'],
                      'timestamp' :[1530479286336096,1530479286362156,1530479286472230]
                    } )
df['date'] = pd.to_datetime(df['timestamp'], unit='us')
display(df)
hover = HoverTool(tooltips=[("x",     "@x"),
                            ("X",     "$x{0.0000}"),
                            ("stuff", "@stuff"),
                            ("Date",  "@date{%Y/%m/%d}")
                           ],
                  formatters = {
                            '@date': 'datetime'
                  }
                 )
display(df)
hv.Scatter( df, kdims='x', vdims=['state', 'stuff', 'date']).opts( tools=[hover], size=10).redim.range(x=(0,7))
1 Like
Thank you ! I am going to look into this!
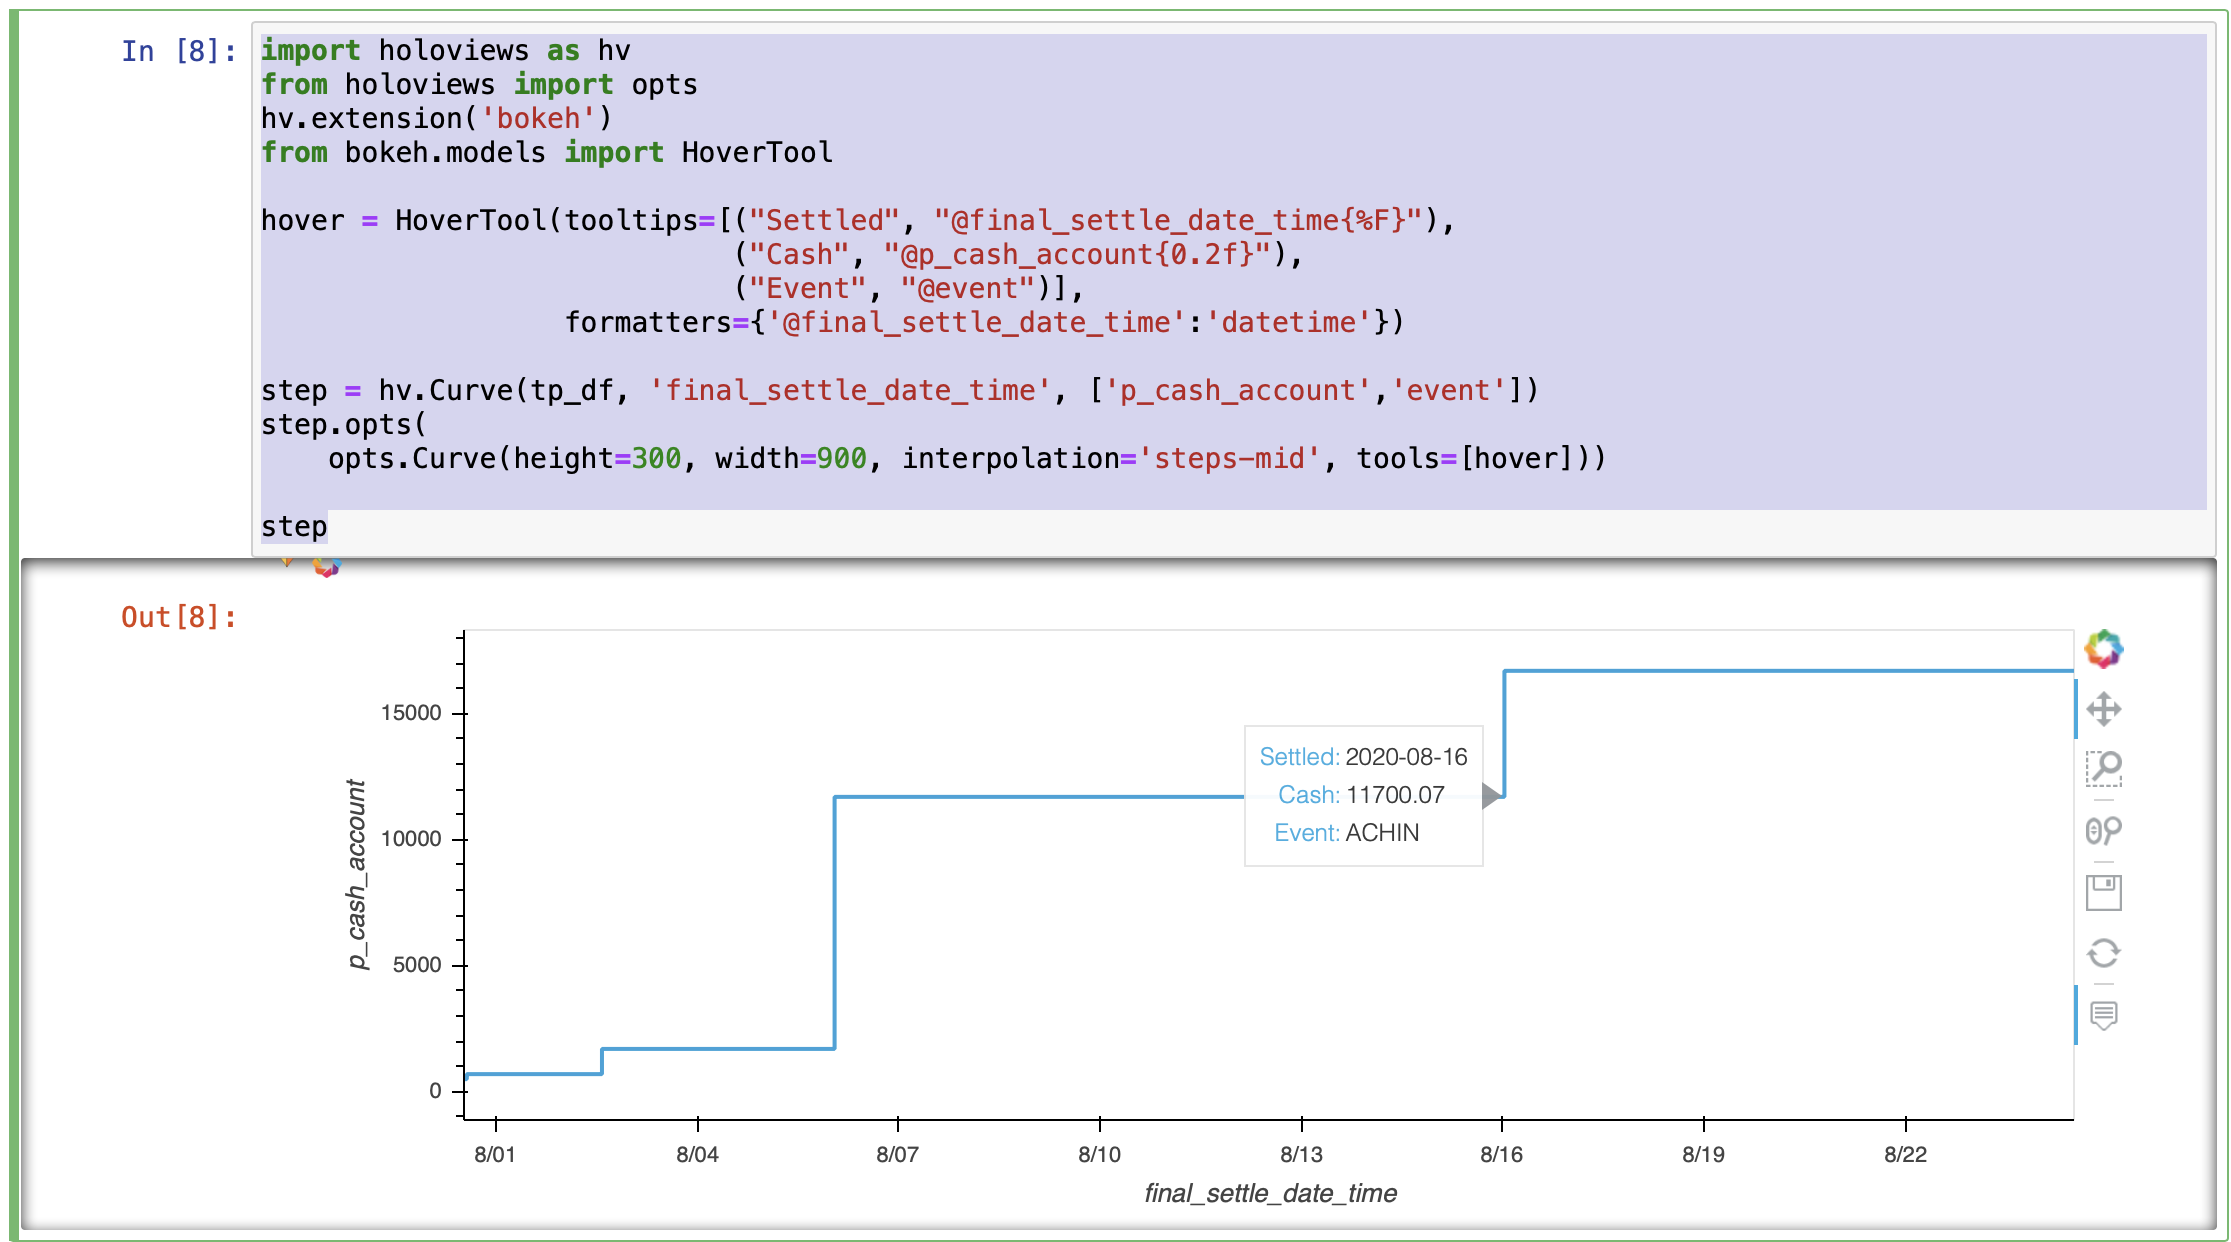
I second that. Thanks! I was able to connect the dots enough based on this post to get this approach working and format my hover values. The downside was that I ended up reimplementing my figure without the hvPlot layer. I still need to figure out how to reconnect it to hvPlot. But I am super grateful for this progress!
Here was my code in hvPlot…
import hvplot.pandas # noqa
tp_df.hvplot.step(x=‘final_settle_date_time’, y=‘p_cash_account’, xlabel=‘Final Settle Date’,
ylabel=‘Cash Balance’, hover=True, hover_cols=‘all’)