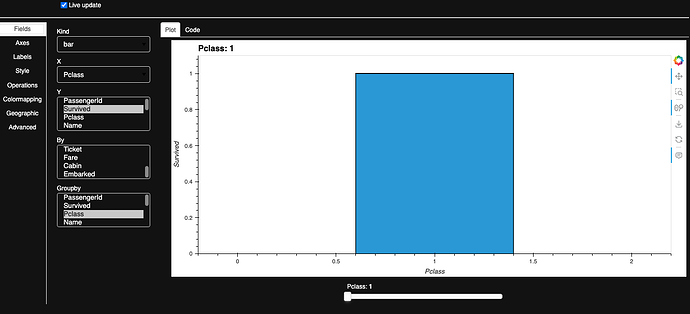
Firstly, Love hvplot.explorer(). I love that it’s like a drop in BI tool in a jupyter notebook.
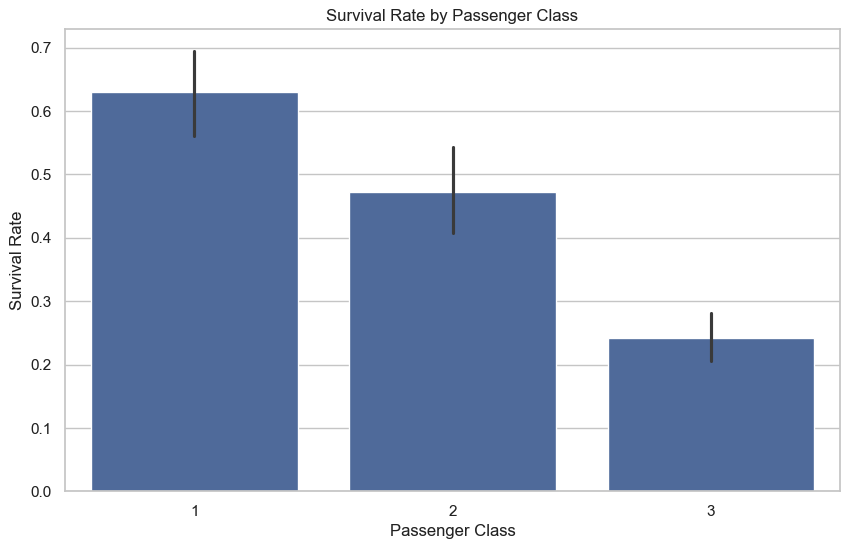
I’m curious how to use to generate a plot like
sns.barplot(x="Pclass", y="Survived", data=df)
import pandas as pd
import seaborn as sns
import matplotlib.pyplot as plt

sns.set(style="whitegrid")
plt.figure(figsize=(10, 6))
sns.barplot(x="Pclass", y="Survived", data=pd.read_csv("https://raw.githubusercontent.com/pandas-dev/pandas/main/doc/data/titanic.csv"))
plt.title("Survival Rate by Passenger Class")
plt.xlabel("Passenger Class")
plt.ylabel("Survival Rate")
plt.show()
I’m not too worried about the error bars.
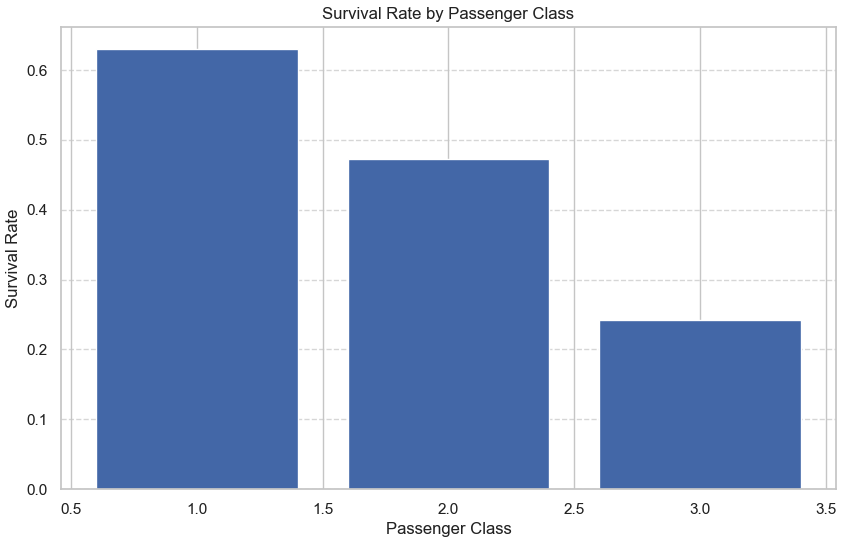
The matplotlib plot code would be
import pandas as pd
import matplotlib.pyplot as plt

survival_rates = pd.read_csv("https://raw.githubusercontent.com/pandas-dev/pandas/main/doc/data/titanic.csv").groupby('Pclass')['Survived'].mean()

plt.figure(figsize=(10, 6))
plt.bar(survival_rates.index, survival_rates.values)
plt.title("Survival Rate by Passenger Class")
plt.xlabel("Passenger Class")
plt.ylabel("Survival Rate")
plt.grid(axis='y', linestyle='--', alpha=0.7)
plt.show()
In the hvplot.explorer i’m looking how to do agg: mean and also plot all the classes on the x axis instead of a slider
import pandas as pd
import hvplot.pandas

df = pd.read_csv("https://raw.githubusercontent.com/pandas-dev/pandas/main/doc/data/titanic.csv")
hvexplorer = df.hvplot.explorer()
hvexplorer


