I am trying to show a plotly express histogram where the user can upload his own data set. I have the following code:
def createHistogram(data=df):
    plot = px.histogram(
        data,
        histnorm="probability",
        x="age",
    )

    return plot

figure = pn.bind(createHistogram, data=df)
However, if no data set has been chosen yet, df is an empty df and has no column “age” yet. The following error is displayed:
ValueError: String or int arguments are only possible when a DataFrame or an array is provided in the data_frame argument. No DataFrame was provided, but argument 'x' is of type str or int.
How do I handle this issue? Should I have a button with an on_click() to trigger updates? Or should I maybe use an if-statement to handle the case in which the df is empty.
carl
September 7, 2023, 12:59pm
2
I generally do a check if data is not none along this lines and sometimes pass in a dummy data frame to produce an empty plot just depends.
What would that dummy df look like? Because providing an empty frame leads to an error or text being visible like Watcher(inst=Button(align='center', button_type='primary', ..., precedence=0)
Marc
September 7, 2023, 3:21pm
4
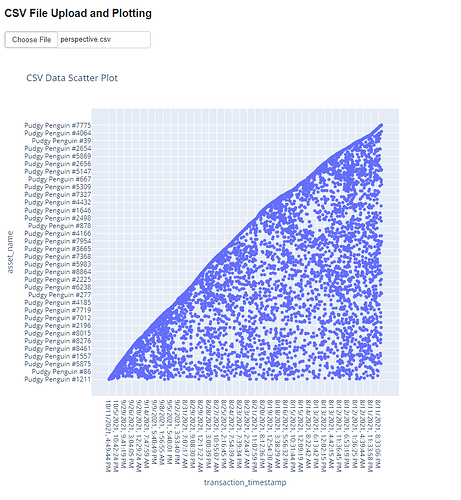
This is almost what ChatGPT told me
import pandas as pd
import panel as pn
import plotly.express as px
import io

pn.extension("plotly")

file_input = pn.widgets.FileInput(accept=".csv")
plot_pane = pn.pane.Plotly(width=800, height=800)

def get_plot(event):
    if file_input.value:
        out = io.BytesIO()
        file_input.save(out)
        out.seek(0)
        df = pd.read_csv(out)
        columns=list(df.columns)
        fig = px.scatter(df, x=columns[1], y=columns[2], title='CSV Data Scatter Plot')
        plot_pane.object = fig
        return plot_pane

    return "Please upload data"

layout = pn.Column(
    '## CSV File Upload and Plotting',
    file_input,
    pn.bind(get_plot, file_input)
)
layout.servable()
This is how I usually do it:
import panel as pn
pn.extension()


def show_selection(select):
    if not select:
        return
    return pn.pane.Markdown(f"You selected {select}")


select = pn.widgets.Select(options=["", "a", "b"])
output = pn.bind(show_selection, select=select)
pn.Row(select, output)
And if you’re streaming, I recommend async generators
import panel as pn
pn.extension()


async def show_selection(select):
    if not select:
        return
    yield pn.pane.Markdown(f"You selected {select}")


select = pn.widgets.Select(options=["", "a", "b"])
output = pn.bind(show_selection, select=select)
pn.Row(select, output)
https://panel.holoviz.org/how_to/interactivity/bind_generators.html
1 Like
Extension for more than 1 figure:
import pandas as pd
import panel as pn
import plotly.express as px
import io

pn.extension("plotly")

file_input = pn.widgets.FileInput(accept=".xlsx")
plot_pane  = pn.pane.Plotly(width=800, height=800)
plot_pane2 = pn.pane.Plotly(width=800, height=800)
plot_pane3 = pn.pane.Plotly(width=800, height=800)


def get_plot(event):
    if file_input.value:
        out = io.BytesIO()
        file_input.save(out)
        out.seek(0)
        df = pd.read_excel(out)
        scatter(df)
        return plot_pane

    return "Please upload data"

def get_plot2(event):
    if file_input.value:
        out = io.BytesIO()
        file_input.save(out)
        out.seek(0)
        df = pd.read_excel(out)
        scatter2(df)
        return plot_pane2

    return "Please upload data"

def get_plot3(event):
    if file_input.value:
        out = io.BytesIO()
        file_input.save(out)
        out.seek(0)
        df = pd.read_excel(out)
        scatter3(df)
        return plot_pane3

    return "Please upload data"

def scatter(df):
    columns=list(df.columns)
    plot_pane.object = px.scatter(df, x=columns[1], y=columns[2], title='CSV Data Scatter Plot')

def scatter2(df):
    columns=list(df.columns)
    plot_pane2.object = px.scatter(df, x=columns[1], y=columns[2], title='CSV Data Scatter Plot')

def scatter3(df):
    plot_pane3.object = px.histogram(
        df,
        histnorm="probability density",
        x=df.columns[1],
    )

layout = pn.Column(
    '## CSV File Upload and Plotting',
    file_input,
    pn.bind(get_plot, file_input),
    pn.bind(get_plot2, file_input),
    pn.bind(get_plot3, file_input)
)

layout.servable()
Marc
September 8, 2023, 4:16pm
7
Just for info @randomBloke and others.
I have created a PR to
remove the need to run .seek(0). I think its just friction.
Add a basic example like the one I provided to the FileInput reference guide.
See FileInput seek 0 by MarcSkovMadsen · Pull Request #5482 · holoviz/panel (github.com) .
2 Likes
Perhaps one remark is that this specific implementation only works for plotly express figures (I think), because we create an empty plot_pane = pn.pane.Plotly(). I suggest also adding an example for matplotlib figures.
Also note that plots using .hvplot() do not work with a pn.pane.Plotly().
Trying this produces the error: ValueError: Plotly pane does not support objects of type 'NdOverlay'.
Also, I am currently trying to figure out how to do this for a calplot, pn.widgets.dataframe, QQ-plot and .hvplot. I think I can figure out the dataframe solution easily, but the others are trickier.
I now also used similar code to update tables/dataframes when data is selected:
import pandas as pd
import panel as pn
import holoviews as hv
import hvplot.pandas
import io


plot_pane = pn.panel(hv.Table(pd.DataFrame()))

def get_table(event):
    if section1_fileUpload1.value:
        data = io.BytesIO()
        section1_fileUpload1.save(data)
        data.seek(0)
        df = pd.read_excel(data)
        displayTable(df)
        return plot_pane

    else:
        return "Please upload data"


def displayTable(df):
    plot_pane.object = hv.Table(df)


file_input = pn.widgets.FileInput(accept=".xlsx")


myTable = pn.bind(get_table, file_input)

dashboard = pn.Column(
    file_input,
    myTable,
    sizing_mode="stretch_width",
)

dashboard.show()
I now also used similar code to update a plotly calplot when data is selected:
import pandas as pd
import panel as pn
import plotly.graph_objs as go
import io
from plotly_calplot import calplot

pn.extension("plotly")


plot_pane = pn.panel(go.FigureWidget())


def get_calplot(event):
    if section1_fileUpload1.value:
        data = io.BytesIO()
        section1_fileUpload1.save(data)
        data.seek(0)
        df = pd.read_excel(data)
        plotCalendar(df)
        return plot_pane

    else:
        return "Please upload data"


def plotCalendar(df):
    plot_pane.object = calplot(
        df.dropna().sort_values("year"),
        x="date",
        y="value",
        years_title=True,
        colorscale="YlGnBu",
    ).update_layout(
        font_color="black",
        plot_bgcolor="white",
    ).update_traces(
        showscale = True,
        selector=dict(type='heatmap'),
    )


file_input = pn.widgets.FileInput(accept=".xlsx")

myCalendar = pn.bind(get_calplot, file_input)

dashboard = pn.Column(
    file_input,
    myCalendar,
    sizing_mode="stretch_width",
)

dashboard.show()
I now also used similar code to update a QQ-plot (matplotlib object) when data is selected and when a toggle is selected from a togglegroup:
import pandas as pd
import panel as pn
import statsmodels.api as sm
from matplotlib.figure import Figure
import io
import scipy.stats as stats

myDistributions = pd.Series([stats.invgauss, stats.norm, stats.gamma], index=["Inverse Gaussian", "Normal",  "Gamma"])
plot_pane = pn.pane.Matplotlib()
file_input = pn.widgets.FileInput(accept=".xlsx")

def qqplot(data, distribution):
    fig = Figure(figsize=(8, 4))
    ax = fig.subplots()
    qq = sm.qqplot(data, fit=True, dist=myDistributions[distribution], ax=ax)
    sm.qqline(qq.axes[0], line='45', fmt='indianred3')
    plot_pane.object = fig

def refreshQQPlotWithSelectedData(event, distribution):
    if file_input.value:
        data = io.BytesIO()
        section1_fileUpload1.save(data)
        data.seek(0)
        df = pd.read_excel(data)
        qqplot(df, distribution)
        return plot_pane

    else:
        return "Please upload data"


toggles = pn.widgets.ToggleGroup(
    name="Select distribution",
    options=myDistributions.index.tolist(),
    behavior="radio",
    value="Normal",
)

myQQFigure= pn.bind(refreshQQPlotWithSelectedData, file_input, distribution=toggles)

dashboard = pn.Column(
    file_input,
    toggles,
    myQQFigure,
)

dashboard.show()
@Marc I was not able to do the same thing (that is, update the data based on a selected file from a FileInput widget) for a param.Parameterized class. I also have no clue on how to approach this.
Also, is it possible to only have one function get_plot() instead of 3 repetitions?

