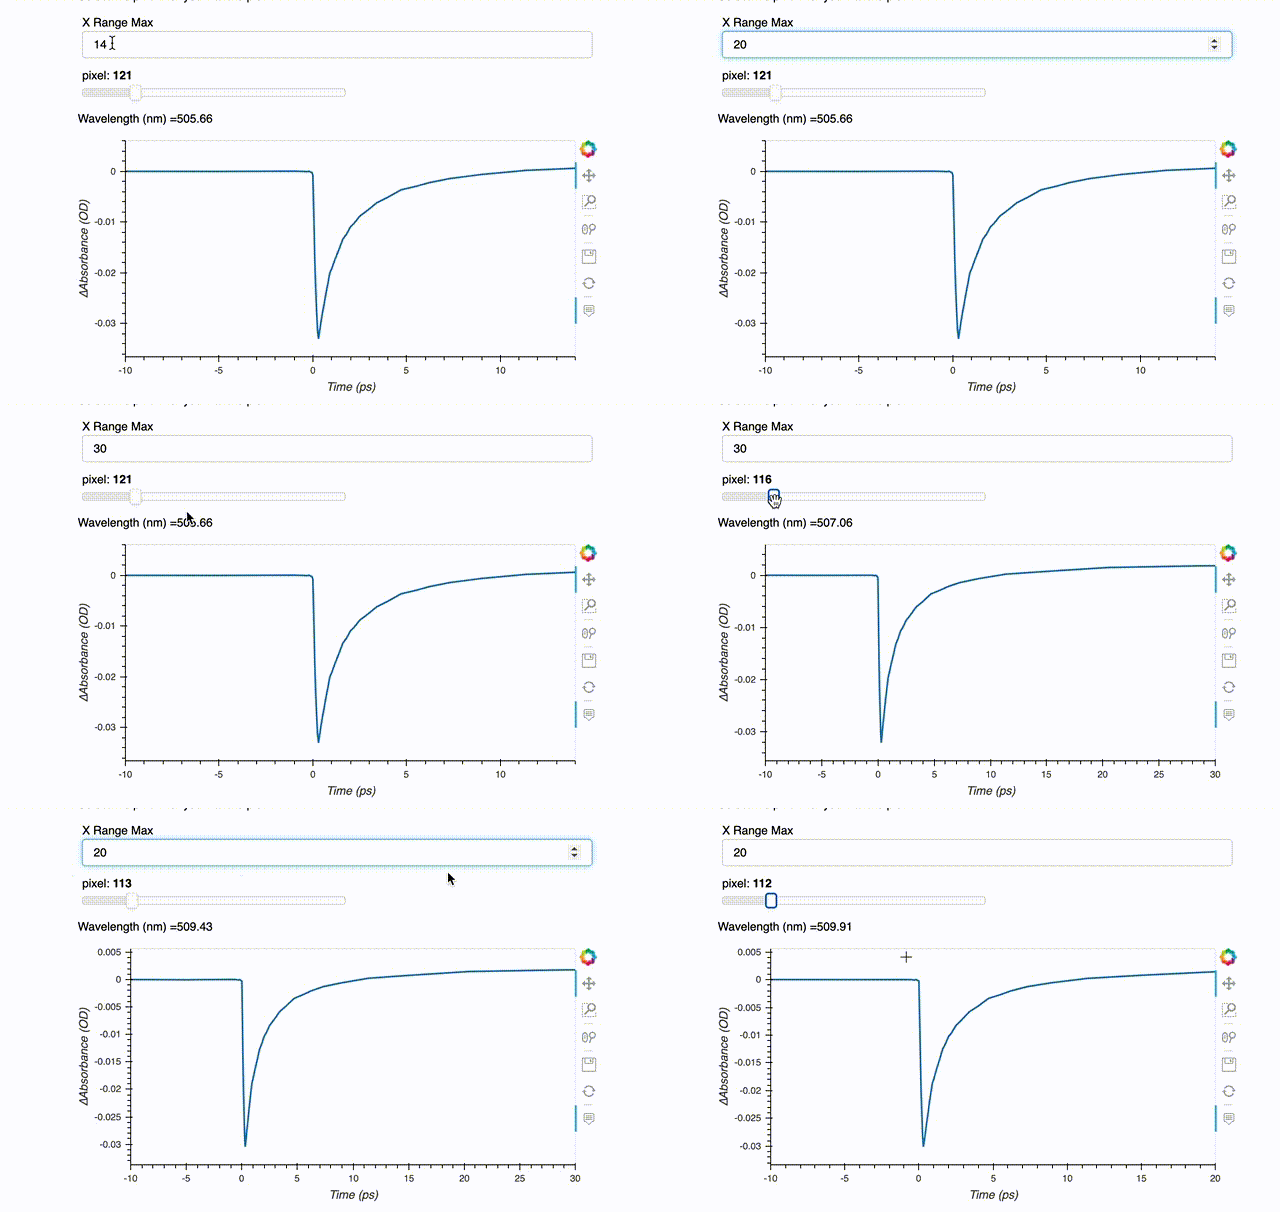
Hello,
I am trying to implement range slider into my figure. I basically want to have a range-slider (with two values) to use for x/y axis range definition in the figures. At the moment, I have one slider (not a range) to define maximum value of X-axis range in the figure. However, it does not work in real-time. Somehow, I have to callback my function to re-plot the figure whenever the value of slider changes. I checked a lot of documentation but could not find a satisfactory answer.

This is my code below. Any guidence, help is highly appreciated!
import pandas as pd
import numpy as np
import panel as pn
import matplotlib.pyplot as plt
import hvplot.pandas
from matplotlib.figure import Figure
from matplotlib.backends.backend_agg import FigureCanvas
from decimal import Decimal

pn.extension()

%matplotlib inline
%matplotlib notebook

# Global variables
fig_width = 600
fig_height = 300

d = np.genfromtxt('visdata.dat', delimiter='\t')
row_data = pd.DataFrame(data=d[0:,0:])
d1 = row_data.iloc[1:,0:] # we use this data frame for plotting time traces.
tim_values = row_data.iloc[1:,0]
min_tim = int(tim_values.min())
max_tim = int(tim_values.max())

x_range_max = pn.widgets.Spinner(name='X Range Max', value=5, step=1, start=min_tim, end=max_tim)

def plot_timtrace(pixel = 1):
    fig1 = d1.hvplot.line(x='0',
                          y=f'{pixel}',
                          xlim=(-10, x_range_max.value),
                          xlabel='Time (ps)',
                          ylabel='∆Absorbance (OD)',
                          width = fig_width,
                          height = fig_height)
    return pn.Column(f'Wavelength (nm) ={row_data.iloc[0,pixel]}',
                     fig1.opts(axiswise=True))

wavelen_text = pn.interact(plot_timtrace,
                           pixel=range(1,len(d1.columns)))

graph1 = pn.Column("<br>\n#Time-Traces\nSelect the pixel that you want to plot.",x_range_max,wavelen_text)