Welcome.
It is not directly supported (yet). See Proposed API for twin-axis support · Issue #5355 · holoviz/holoviews · GitHub
The workaround is to use a hook, and it depends on what backend you use. This hook works but can give problems when using some of the more advanced features in Holoviews, which is the package hvplot uses behind the scene:
import hvplot.pandas
import numpy as np
import pandas as pd
from bokeh.models import GlyphRenderer, LinearAxis, LinearScale, Range1d
x = np.random.randint(10, size=(10, 3))
x[:, 2] = np.cumsum(x[:, 2], axis=0)
df = pd.DataFrame(x, columns=["game", "count", "cumul_prop"])
# INITIALIZE plots
plot_1 = df.hvplot.bar(x="game", y="count", yaxis="left")
plot_2 = df.hvplot.line(x="game", y="cumul_prop", yaxis="right")
def overlay_hook(plot, element):
# Adds right y-axis
p = plot.handles["plot"]
p.extra_y_scales = {"right": LinearScale()}
p.extra_y_ranges = {"right": Range1d(0, 50)}
p.add_layout(LinearAxis(y_range_name="right"), "right")
# find the last line and set it to right
lines = [p for p in p.renderers if isinstance(p, GlyphRenderer)]
lines[-1].y_range_name = "right"
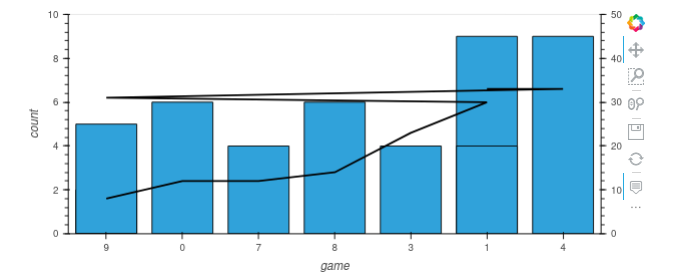
(plot_1.opts(ylim=(0, 10)) * plot_2.opts(color="k")).opts(hooks=[overlay_hook])
A small note: If you need help next time, try to post a minimal, reproducible example (MRE) with imports and fake data. This will make it much easier for people to help you.