Hi
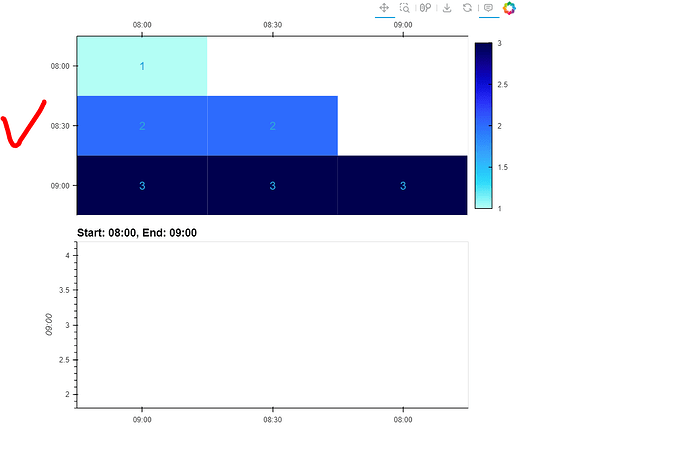
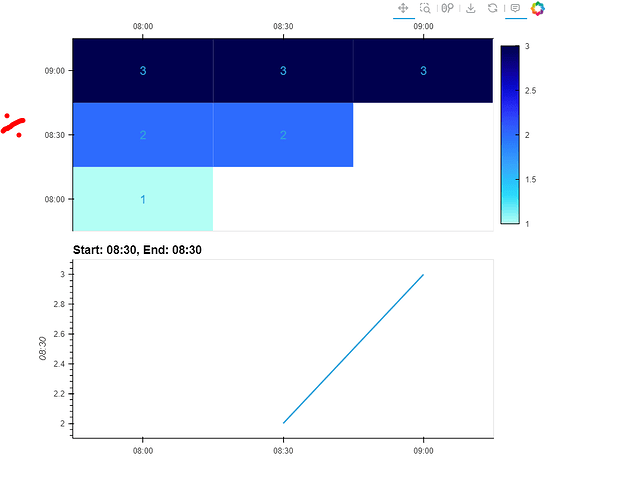
We’re trying to add a Tap stream to a heatmap. The y-axis of the heatmap is inverted before the tap. But after the tap it is no longer.
How do we keep the yaxis inverted before and after the tap?
ps. We’ve tried all the combinations of .opts we can think of.
Reproducible Example
import pandas as pd
import panel as pn
import hvplot.pandas
import holoviews as hv
import numpy as np
pn.extension()

data=pd.DataFrame({
    "08:00": [1,2,3],
    "08:30": [np.NaN,2,3],
    "09:00": [np.NaN,np.NaN,3],
}, index=["08:00", "08:30", "09:00"],)

heatmap = data.hvplot.heatmap(x="columns", y="index", xaxis="top").opts(invert_yaxis=True)

posxy = hv.streams.Tap(source=heatmap, x=data.columns[0], y=data.index[-1])

def tap_histogram(x, y):
    plot_data = data.copy()

    plot_data.columns = [str(i)[:5] for i in plot_data.columns]
    plot_data.index = [str(i)[:5] for i in plot_data.index]

    return plot_data.hvplot(x="index", y=y, title=f"Start: {x}, End: {y}")

tap_dmap = hv.DynamicMap(tap_histogram, streams=[posxy])

label_data = data.fillna("")
heatmap_label = label_data.hvplot.heatmap(
    x="columns",
    y="index",
    xaxis="top",
).opts(
    invert_yaxis=True,
)
heatmap_labels = hv.Labels(heatmap_label)

plot = (heatmap * heatmap_labels + tap_dmap).cols(1)
pn.panel(plot).servable()
Before tap
After tapping 8:30/ 8:30 cell

